Riding The Wave Weekly Outlook #70
Welcome to Riding The Wave. If you have questions or feedback, please reply to this email. If you are new to the Newsletter, please check out what we provide on our about page and consider subscribing. Within the Newsletter, I provide News Summaries, Weekly Status Updates, & Deep Dive Articles on Specific Topics (Ex: How do I pick which coins/tokens to buy?). More details here
Table of Contents
Tweets
What’s Happening Now?
What Might Happen Next?
Tweets
https://twitter.com/_AustinHerbert/status/1649428887414120450
https://twitter.com/WatcherGuru/status/1649141699757629442
https://twitter.com/rektcapital/status/1649084041415606278
https://twitter.com/intocryptoverse/status/1649080184807514113
https://twitter.com/WatcherGuru/status/1648827603522920449
What’s Happening Now?
Bitcoin(BTC)
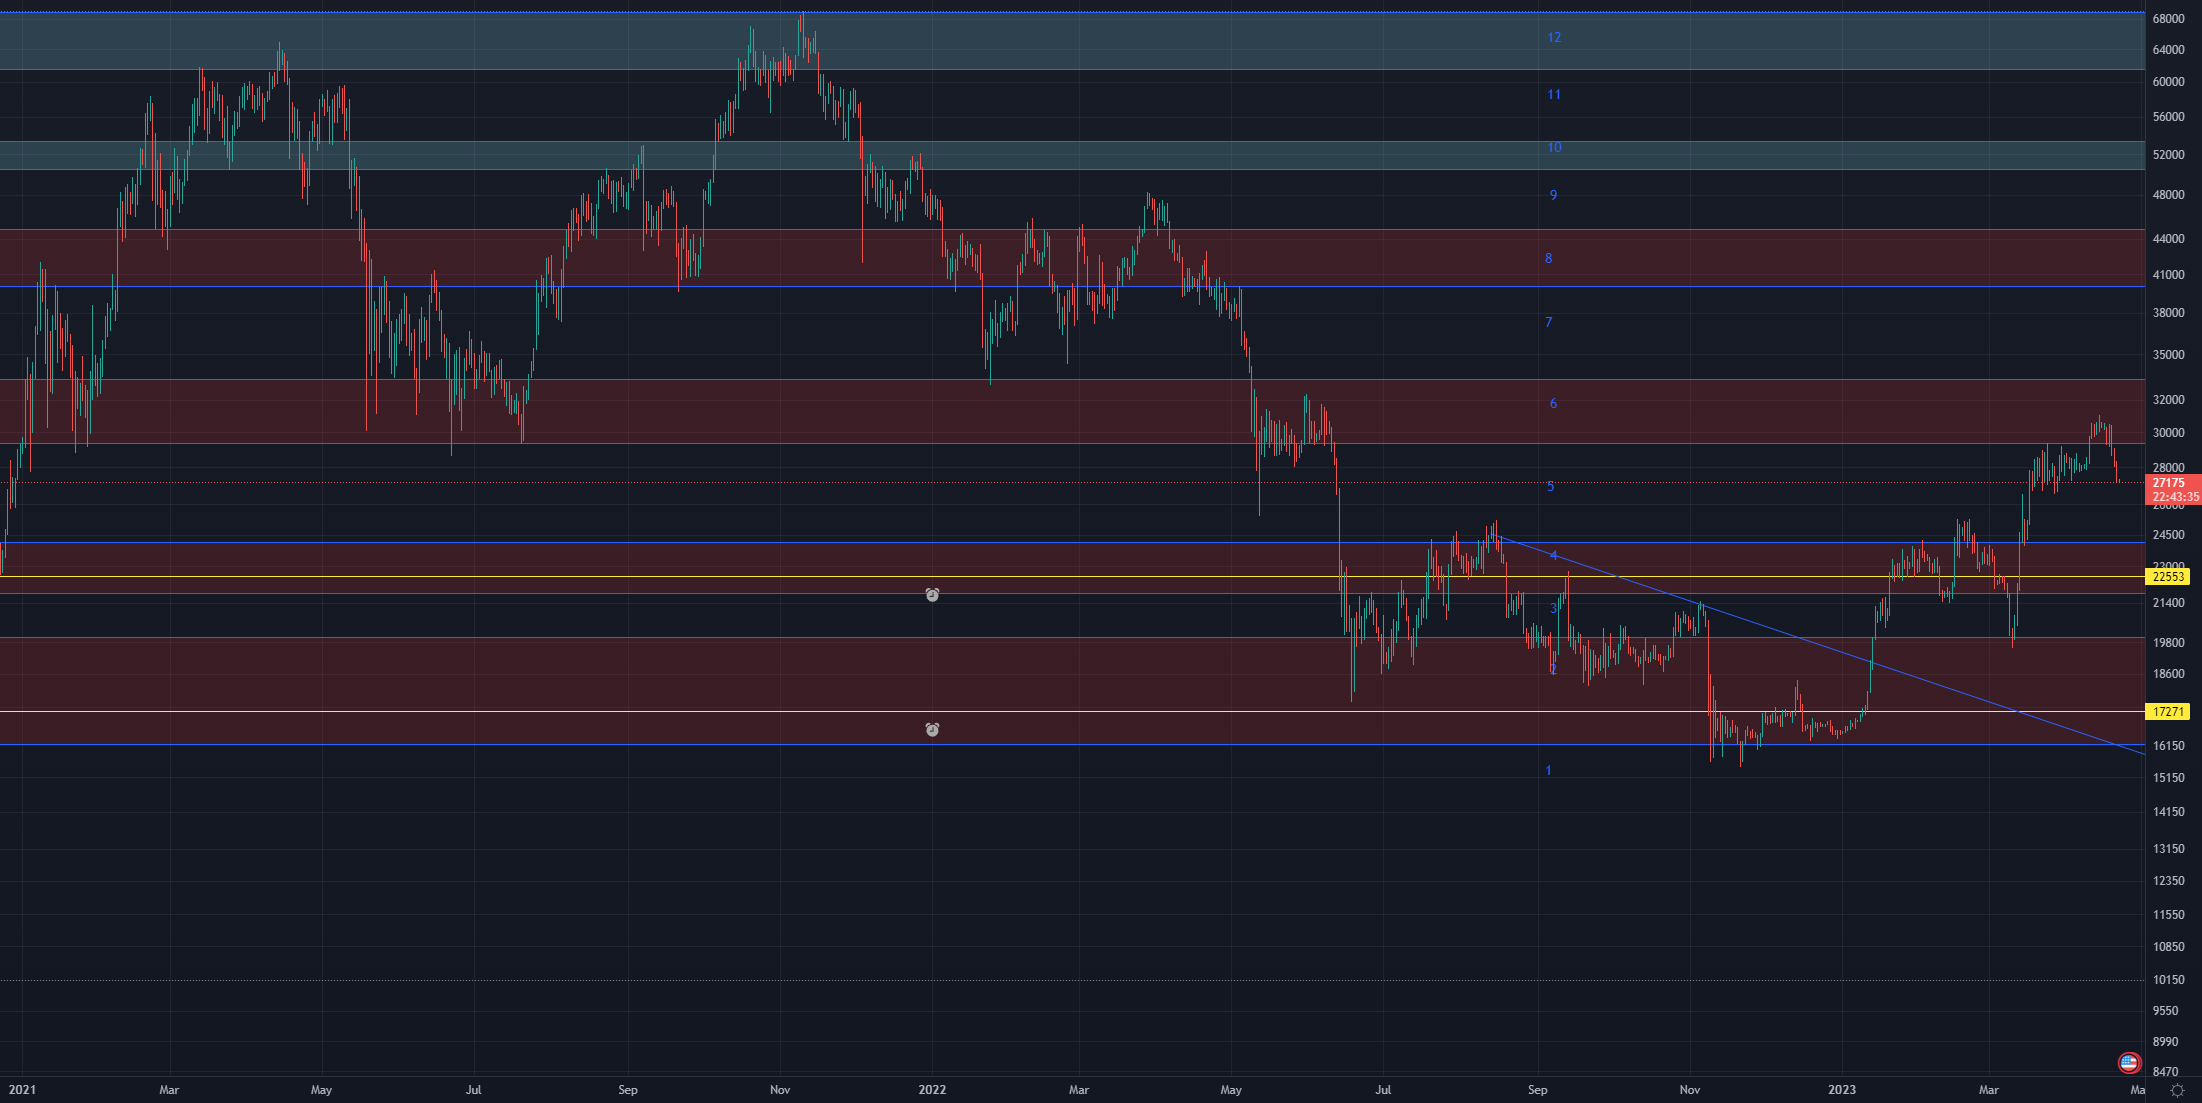
Bitcoin has dropped down to the highest of the SMA’s (8-week SMA) we track to retest for support.

Bitcoin has failed to find support inside the 6th region and has called into the 5th.

Ethereum(Eth)
Ethereum has also fallen to its highest SMA (8-Week SMA) and is looking for support.
On the daily time frame, Ethereum has failed to find support at the bottom of the 9th resistance region and has fallen into the 8th.

Cardano(Ada)
Cardano has fallen back below the 50-week SMA and appears to be finding support on its 8-week SMA.
On the daily time frame, Cardano has failed to stay in the 6th region and fallen back into the 5th.

What Might Happen Next?
Keep reading with a 7-day free trial
Subscribe to Riding The Wave to keep reading this post and get 7 days of free access to the full post archives.


