Riding The Wave Weekly Outlook #68
Welcome to Riding The Wave. If you have questions or feedback, please reply to this email. If you are new to the Newsletter, please check out what we provide on our about page and consider subscribing. Within the Newsletter, I provide News Summaries, Weekly Status Updates, & Deep Dive Articles on Specific Topics (Ex: How do I pick which coins/tokens to buy?). More details here
Table of Contents
Tweets
What’s Happening Now?
What Might Happen Next?
Tweets
There is an issue between Substack and Twitter for embedding tweets. A partial fix is now in place as it allows me to include the links and some of the tweets embed but as can be seen below, a full fix is not yet available
https://twitter.com/financialjuice/status/1644289275767271426
https://twitter.com/therationalroot/status/1644382731877621760
https://twitter.com/nickgerli1/status/1644405321828294657
https://twitter.com/MacroAlf/status/1644380036500160520
https://twitter.com/WatcherGuru/status/1644319529542008833
https://twitter.com/WatcherGuru/status/1644178688714342401
https://twitter.com/WhaleChart/status/1644083254364864516
https://twitter.com/thepowerfulHRV/status/1643713198439407618
https://twitter.com/100trillionUSD/status/1643939415985729539
What’s Happening Now?
Bitcoin(BTC)
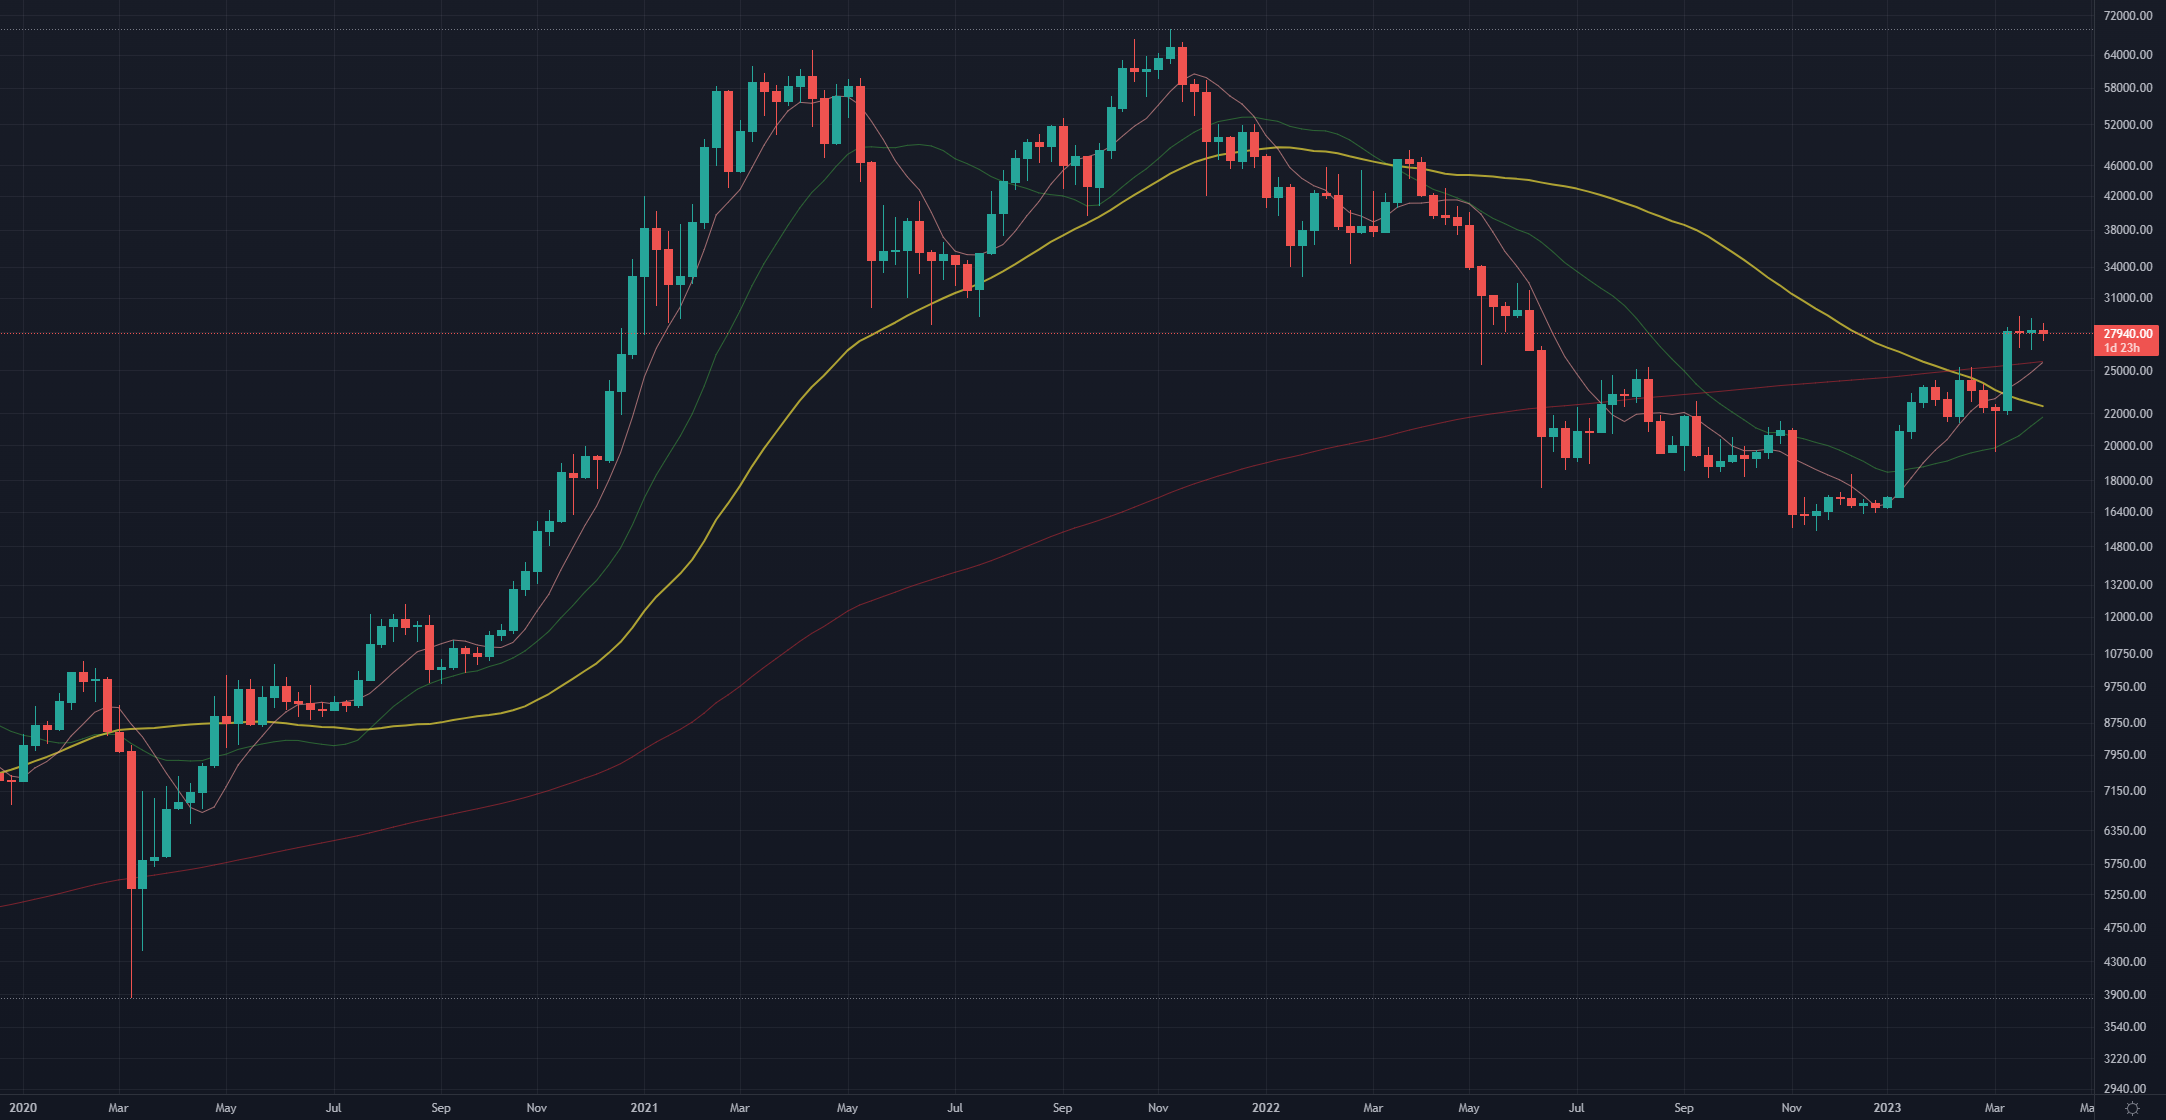
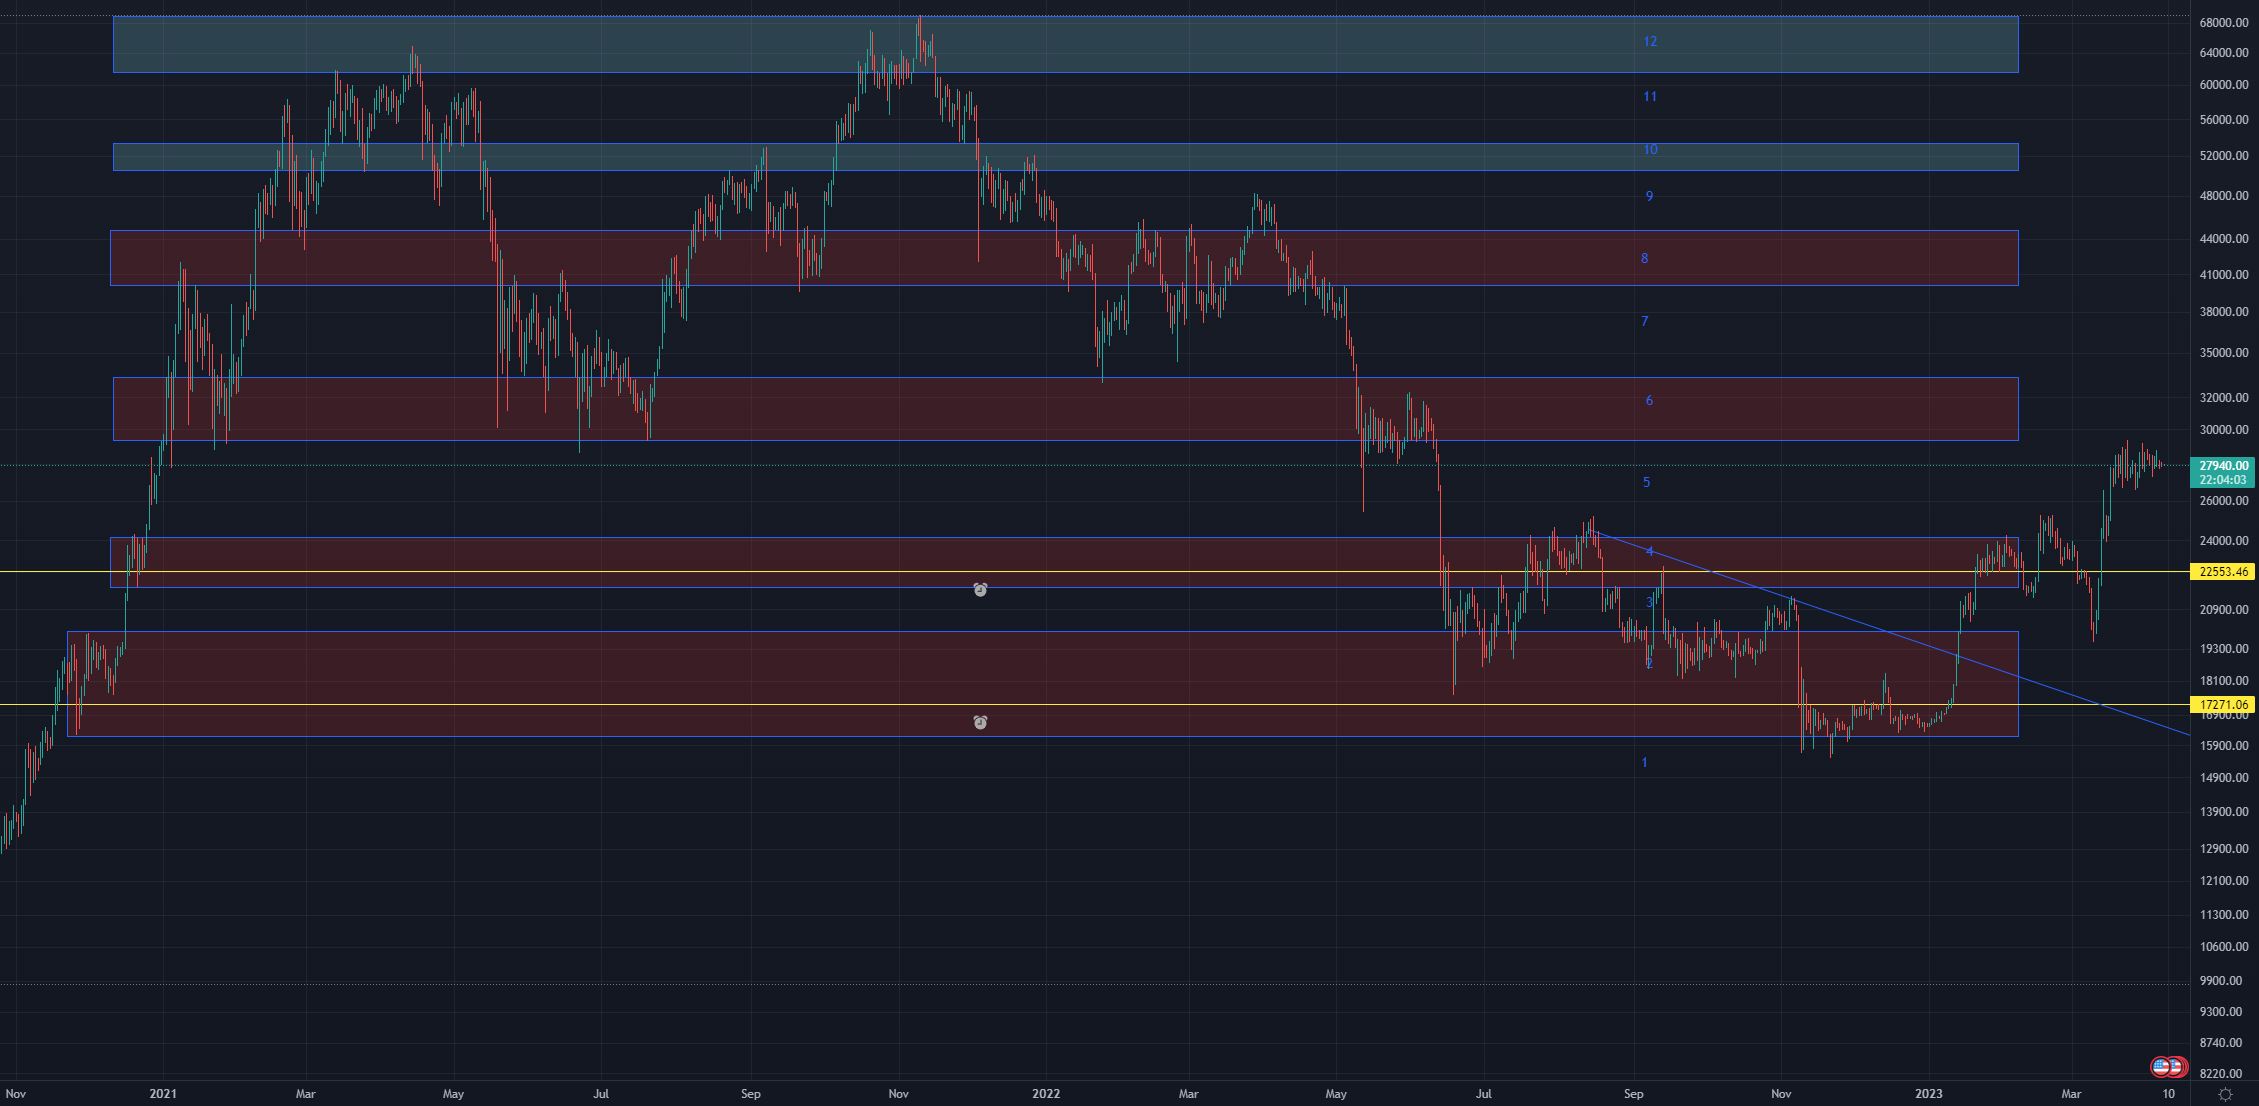
Bitcoin has continued moving sideways after hitting $30k.

Bitcoin has continued to find resistance at the bottom of the 6th resistance area.

Ethereum(Eth)
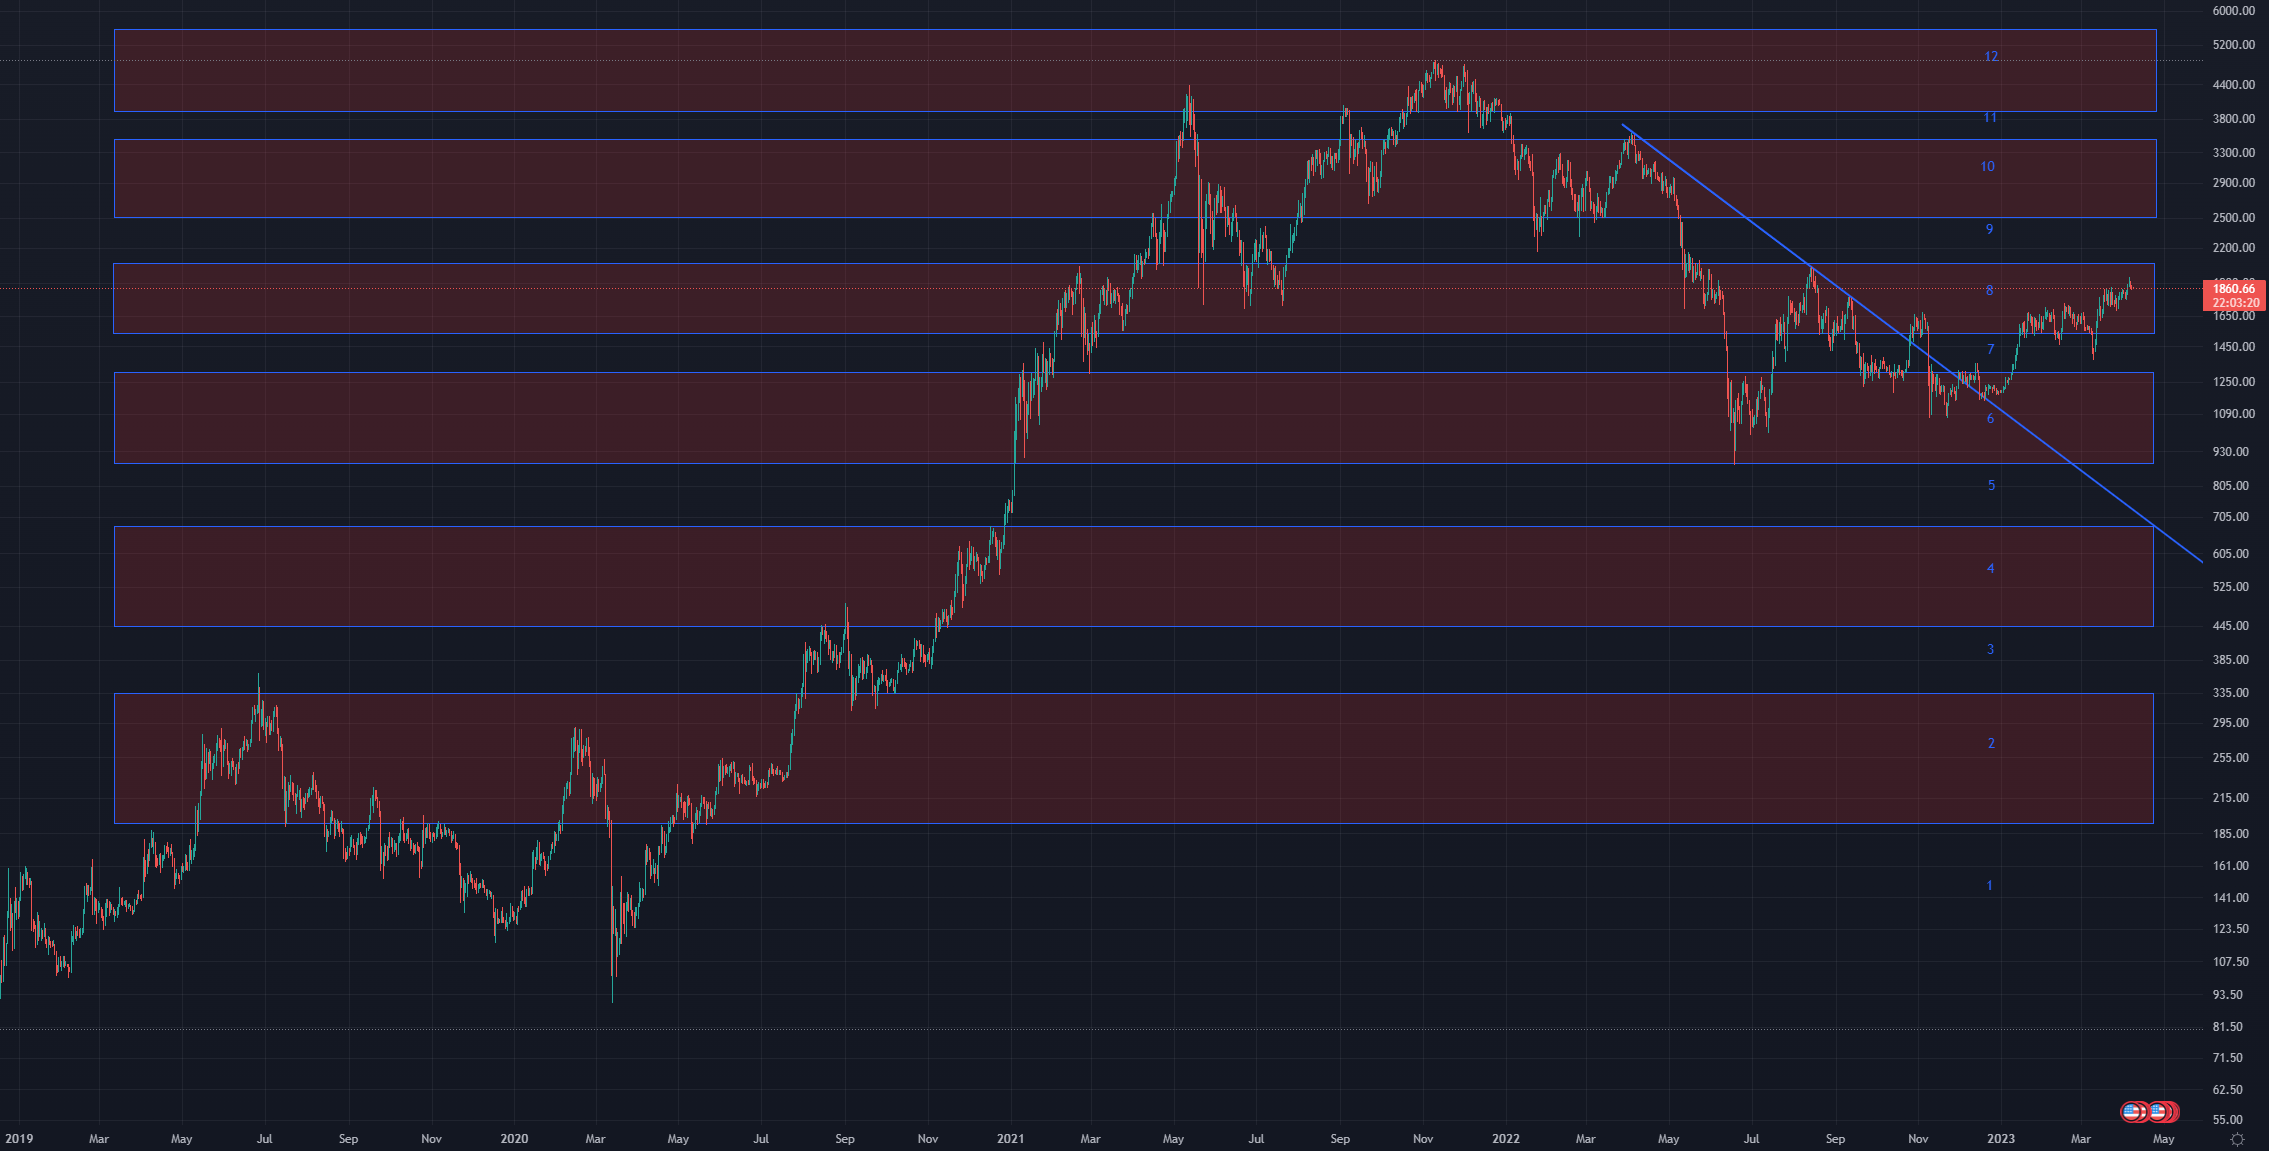
Ethereum is still above all 4 of its SMA’s and is still finding resistance at the $1900 mark.
On the daily time frame, Ethereum is still in the middle of the 8th resistance area.

Cardano(Ada)
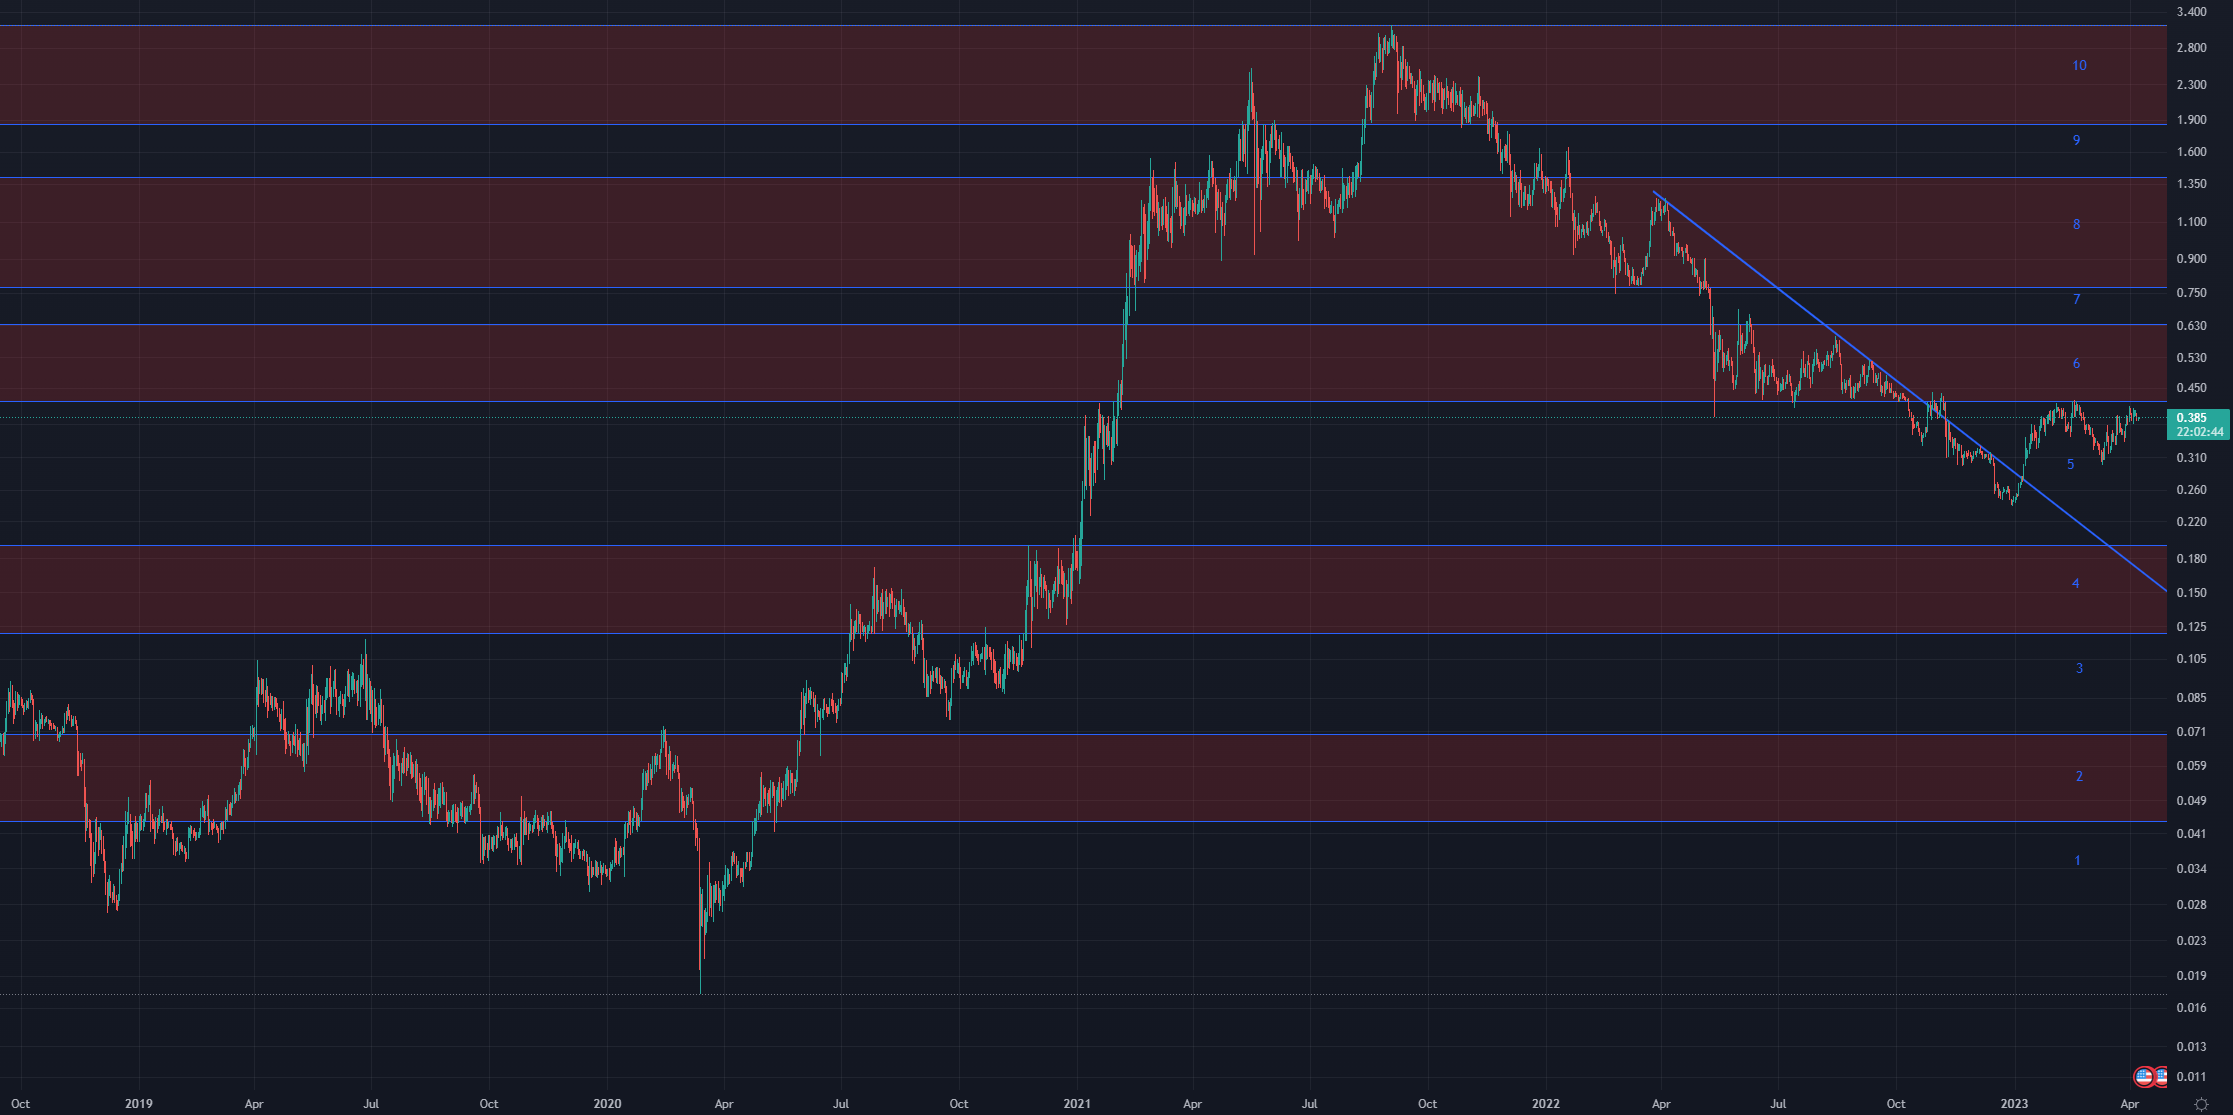
Cardano has been rejected by the 50-week SMA but has not fallen below its 8-week SMA.
On the daily time frame, Cardano is still at the top of the 5th resistance area.

What Might Happen Next?
Keep reading with a 7-day free trial
Subscribe to Riding The Wave to keep reading this post and get 7 days of free access to the full post archives.


