Riding The Wave

Riding The Wave

Share this post

Riding The Wave
Riding The Wave
Riding The Wave Weekly Outlook #19

Riding The Wave Weekly Outlook #19

Thomas Holland's avatar
Thomas Holland
May 06, 2022
∙ Paid
1

Share this post

Riding The Wave
Riding The Wave
Riding The Wave Weekly Outlook #19
Share

Welcome to Riding The Wave. If you have questions or feedback, please reply to this email. If you are new to the Newsletter, please check out what we provide on our about page and consider subscribing. Within the Newsletter, I provide News Summaries, Weekly Status Updates, & Deep Dive Articles on Specific Topics (Ex: How do I pick which coins/tokens to buy?). More details here

Table of Contents

  1. Tweets

  2. What’s Happening Now?

  3. What Might Happen Next?


Tweets

Twitter avatar for @ecoinometrics
ecoinometrics @ecoinometrics
The stock market is heading for one of those outliers...
Image
2:05 PM ∙ May 6, 2022
36Likes7Retweets
Twitter avatar for @ecoinometrics
ecoinometrics @ecoinometrics
The stock market is heading for one of those outliers...
Image
2:05 PM ∙ May 6, 2022
36Likes7Retweets
Twitter avatar for @WatcherGuru
Watcher.Guru @WatcherGuru
JUST IN: The Federal Reserve (FED) has raised interest rates by 0.5%, its biggest hike since 2000.
6:21 PM ∙ May 4, 2022
3,101Likes612Retweets
Twitter avatar for @Blockworks_
Blockworks @Blockworks_
NEW: Vatican to create an NFT gallery to democratize art
Image
12:39 PM ∙ May 4, 2022
3,653Likes793Retweets
Twitter avatar for @BTC_Archive
Bitcoin Archive 🗄🚀🌔 @BTC_Archive
#Bitcoin Fear and Greed index at 21 when the price is $38.9k I like that a lot! 🙌
Image
10:19 AM ∙ May 4, 2022
1,571Likes166Retweets
Twitter avatar for @ecoinometrics
ecoinometrics @ecoinometrics
Seems that the whales addresses like #Bitcoin at $38k. Starting to see some cluster of 🔴🔴🔴🔴
Image
12:54 AM ∙ May 4, 2022
998Likes175Retweets

What’s Happening Now?

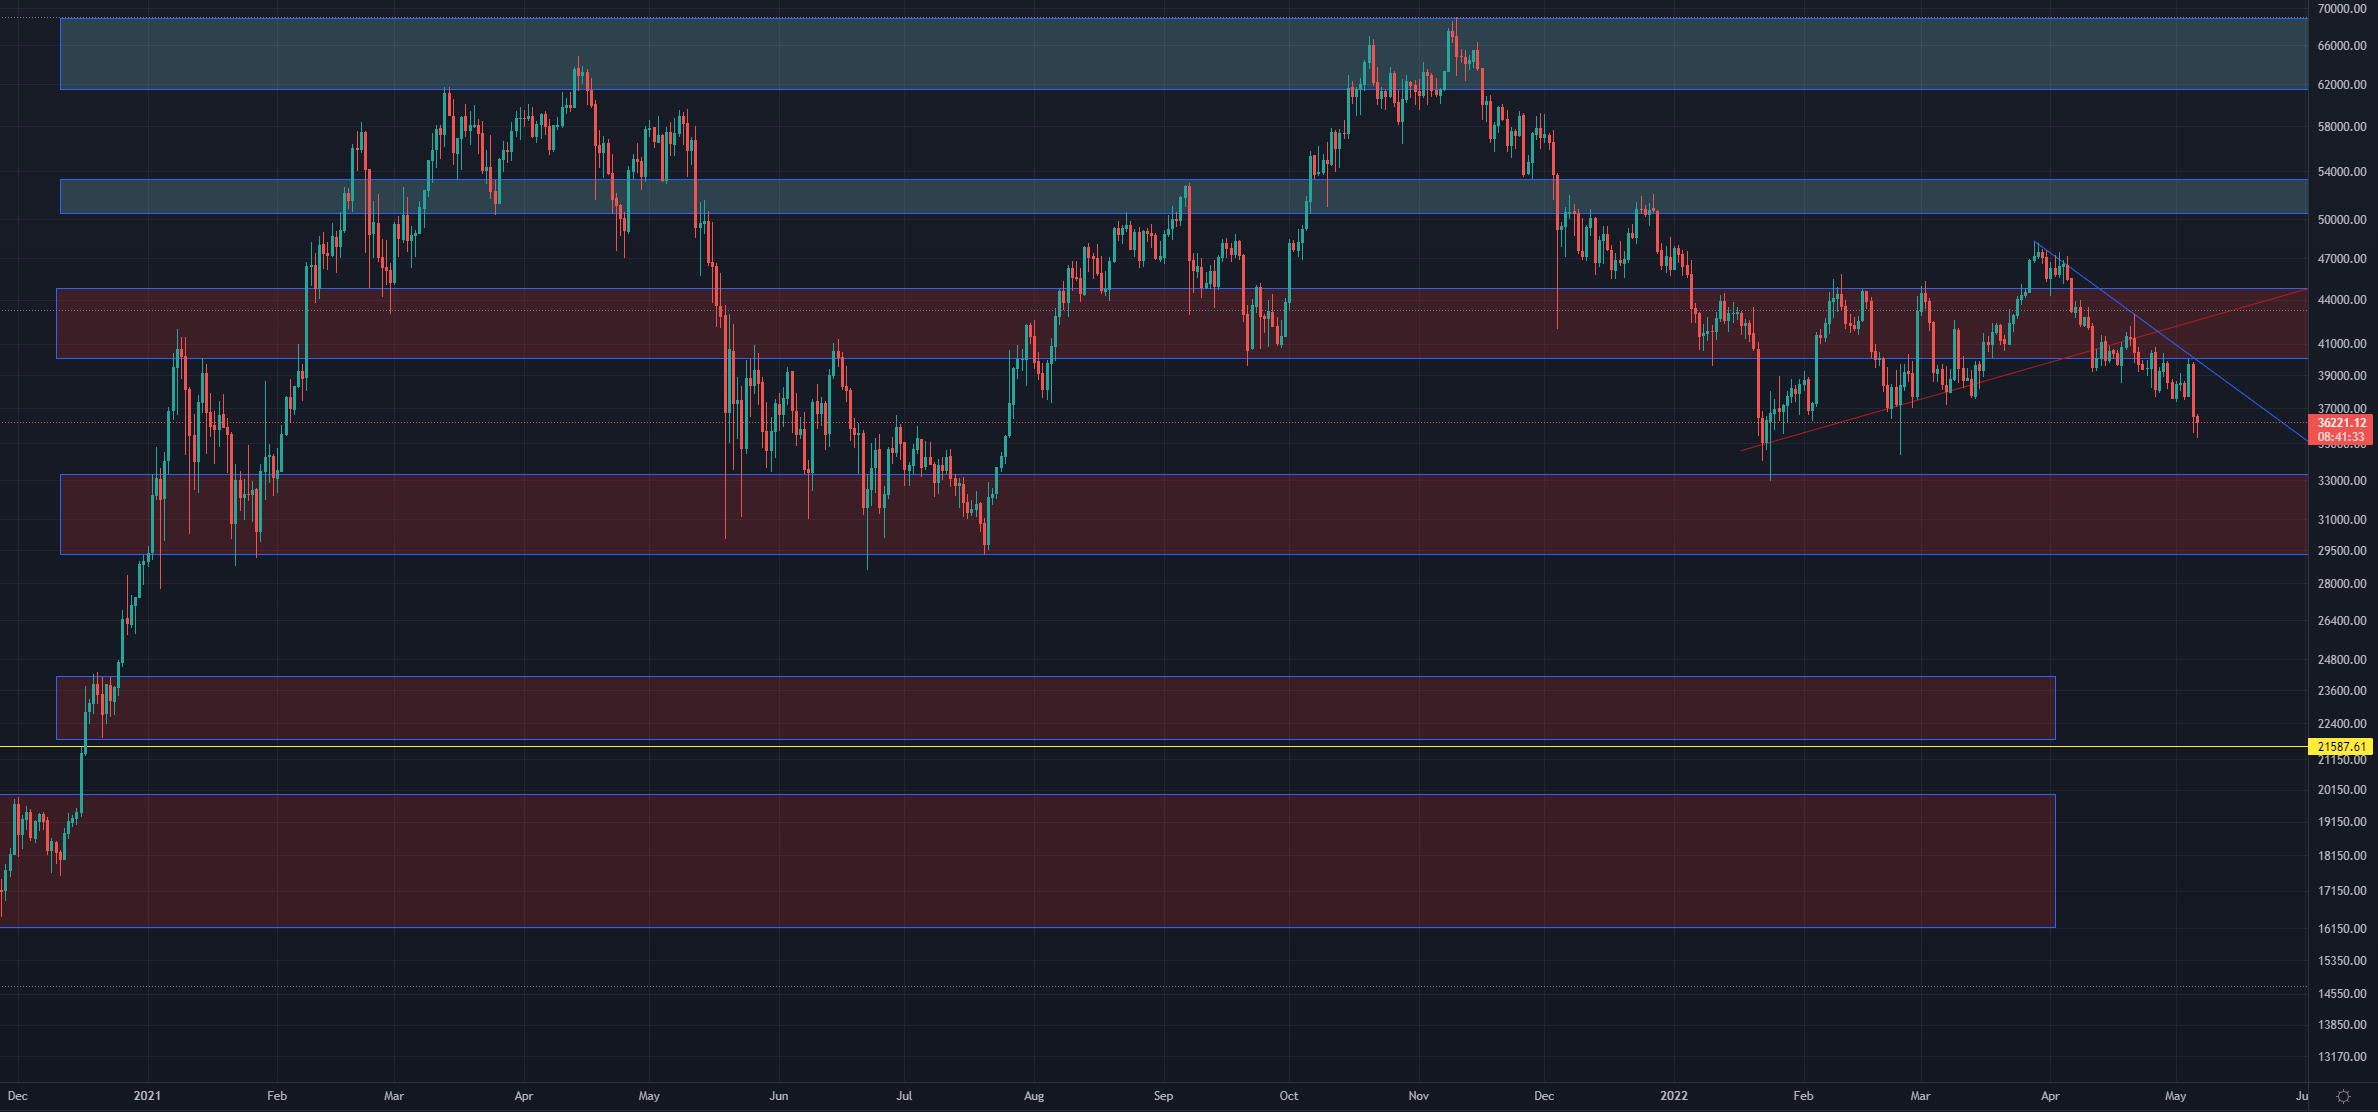
With traditional markets continuing to trend downwards Bitcoin has followed. It is now far (approx $5k) below the core SMA’s.

Weekly Timeframe Bitcoin

On the daily time frame, Bitcoin has been rejected off of the bottom of the red box (support/resistance area) which sent it down into a significant drop. We no longer appear to be following the red trend line Bitcoins price established before and appear to instead be trending downwards sharply following the blue line.

Daily Timeframe Bitcoin. Red/blue boxes are potential areas of support/resistance, the red line shows potential area of support that we no longer seem to be following, blue line represents downtrend we seem to be following, yellow line represents 200 week SMA

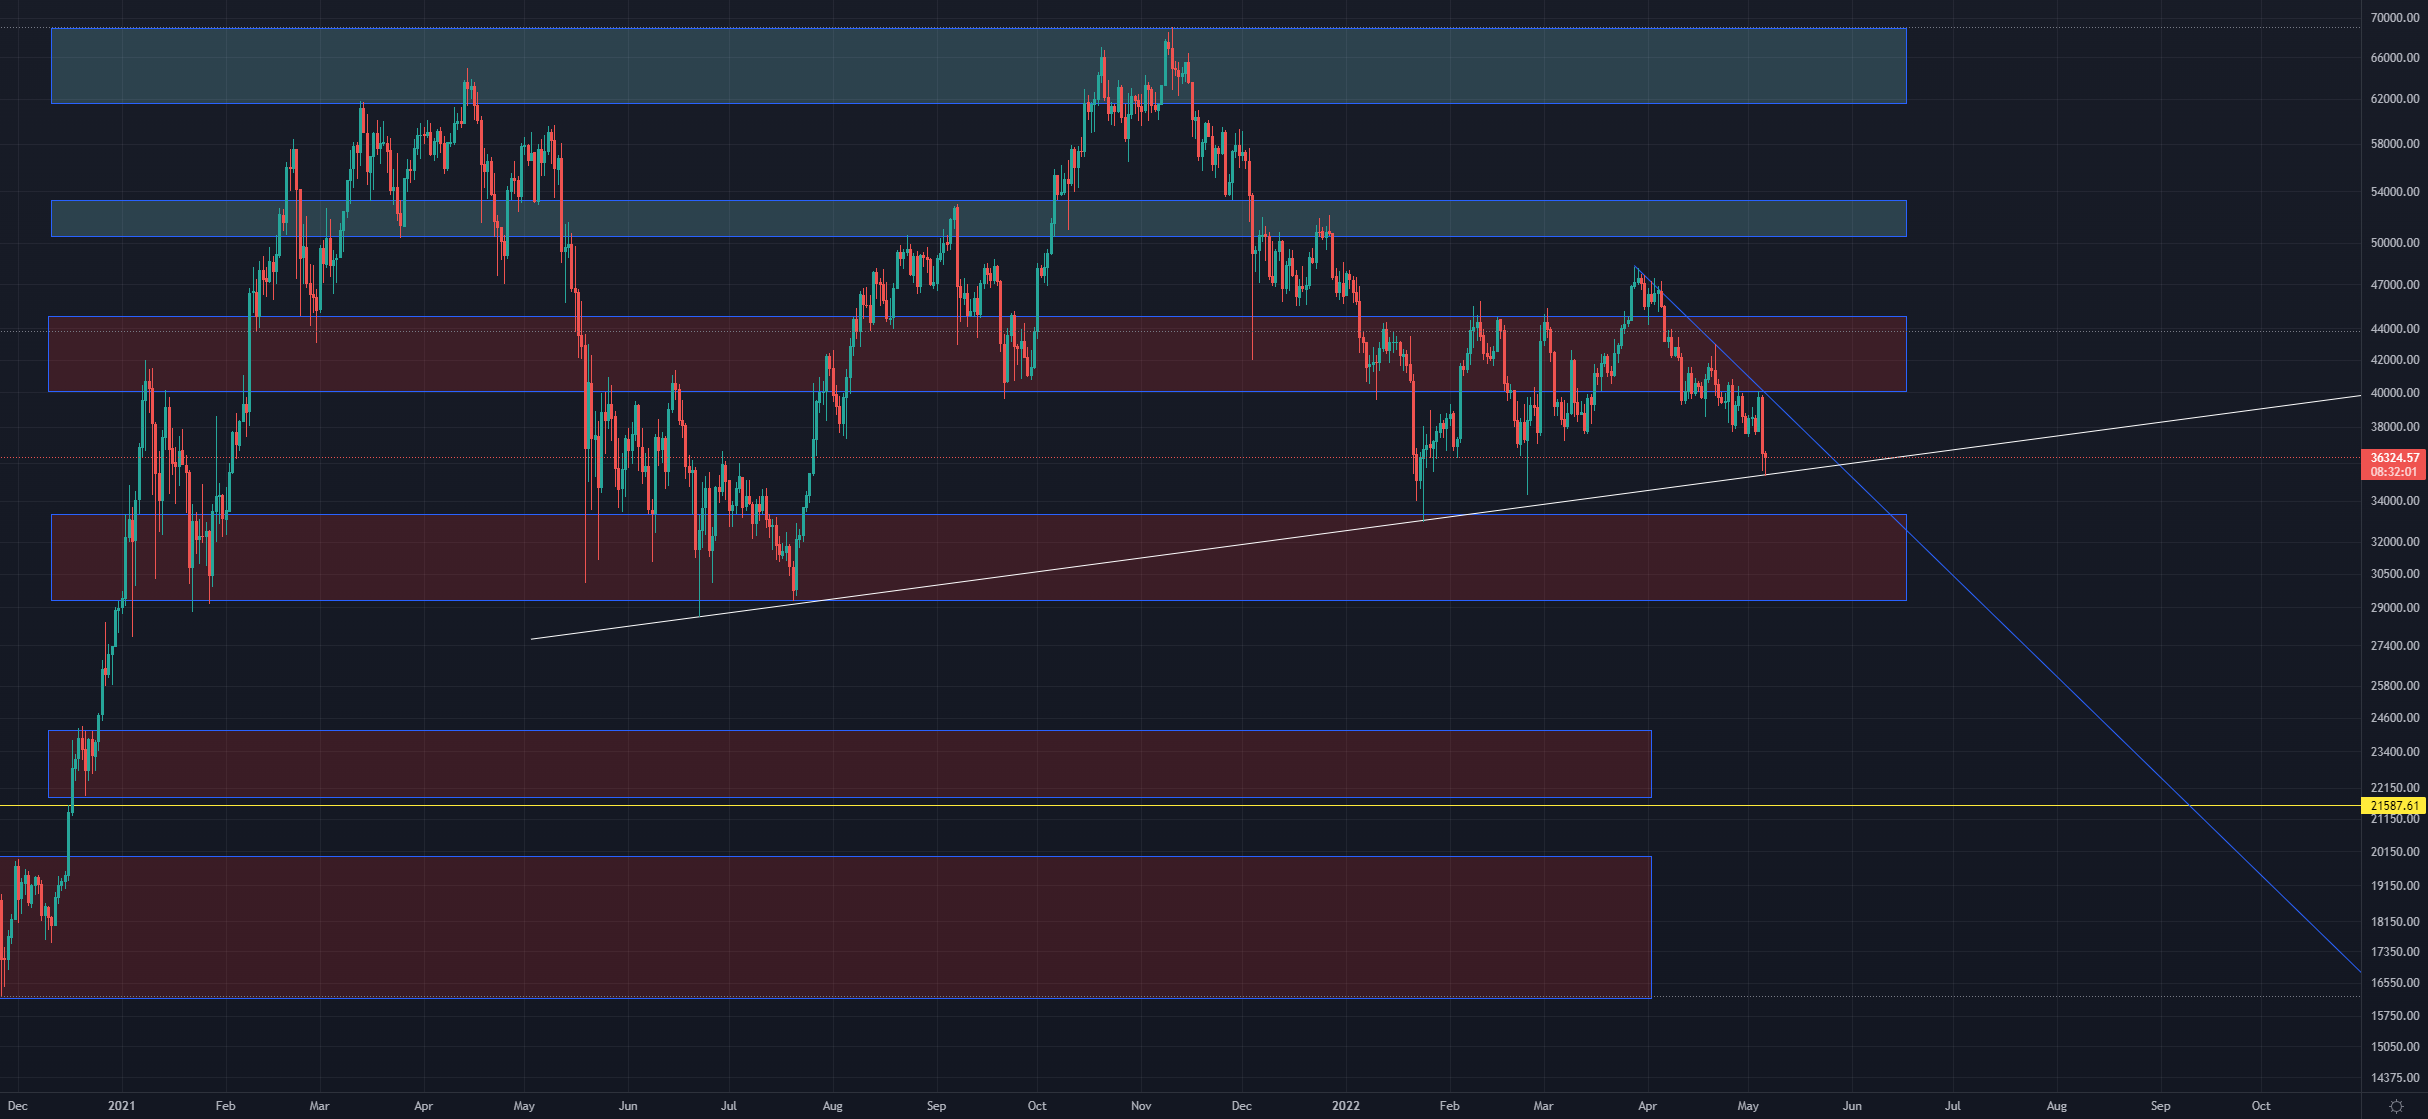
If you will look below you can see the white line which is trending upwards, many investors view this lower band as being due to investors continually averaging in slowly raising the price even without an influx of new investors in the crypto space.

Daily Timeframe Bitcoin. Red/blue boxes are potential areas of support/resistance, blue line represents downtrend we seem to be following, yellow line represents 200 week SMA, white line represents potential support that is trending up due to people averaging in over time

What Might Happen Next?

Keep reading with a 7-day free trial

Subscribe to Riding The Wave to keep reading this post and get 7 days of free access to the full post archives.

Already a paid subscriber? Sign in
© 2025 Thomas Holland
Privacy ∙ Terms ∙ Collection notice
Start writingGet the app
Substack is the home for great culture

Share