


Riding The Wave Weekly Outlook #110
Welcome to Riding The Wave. If you have questions or feedback, please reply to this email. If you are new to the Newsletter, please check out what we provide on our about page and consider subscribing. Within the Newsletter, I provide News Summaries, Weekly Status Updates, & Deep Dive Articles on Specific Topics (Ex: How do I pick which coins/tokens to buy?). More details here
Table of Contents
Tweets
What’s Happening Now?
What Might Happen Next?
Tweets
https://twitter.com/WClementeIII/status/1757849445121638621

https://twitter.com/intocryptoverse/status/1757927309674164438

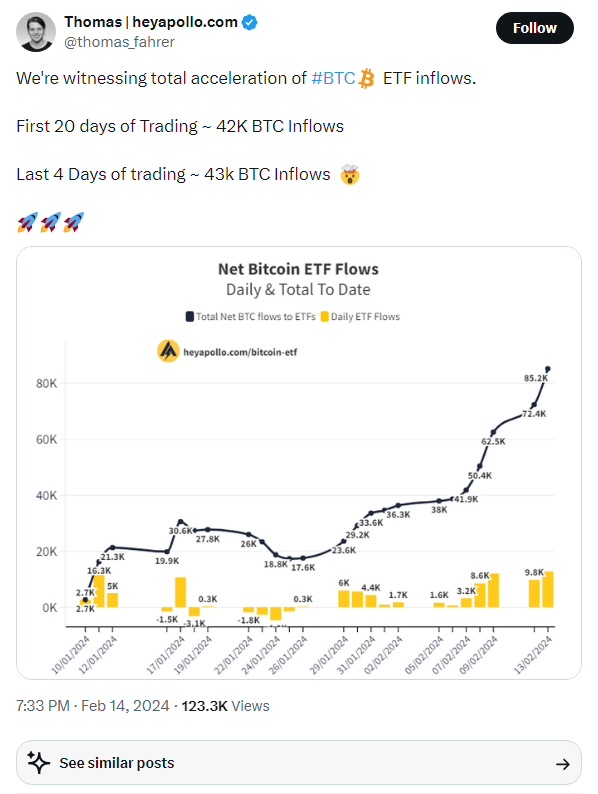
https://twitter.com/thomas_fahrer/status/1757926080248426863
https://twitter.com/stackhodler/status/1758096264426586118

https://twitter.com/GameofTrades_/status/1758113933133521196

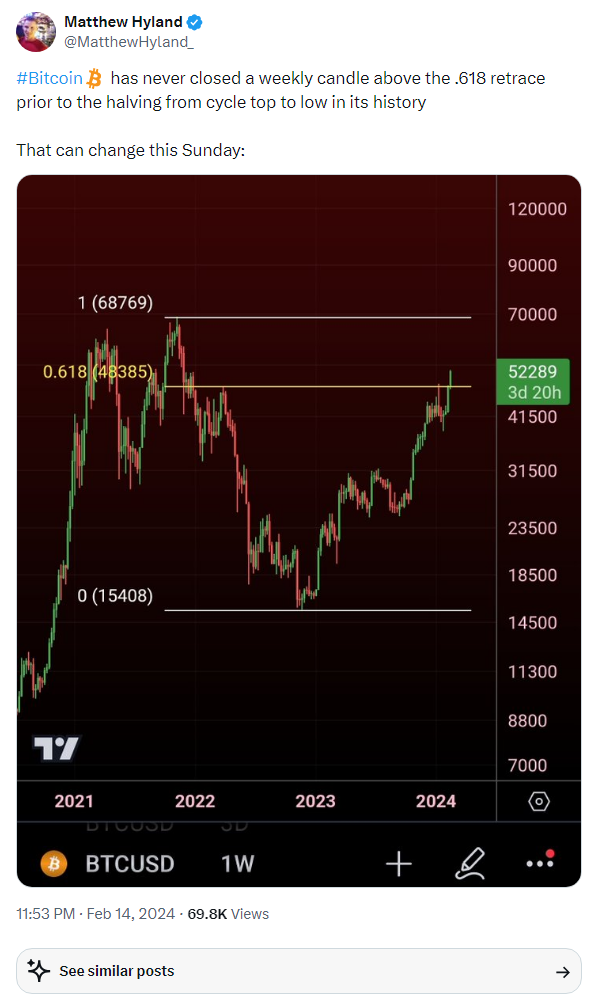
https://twitter.com/MatthewHyland_/status/1757991488493945224
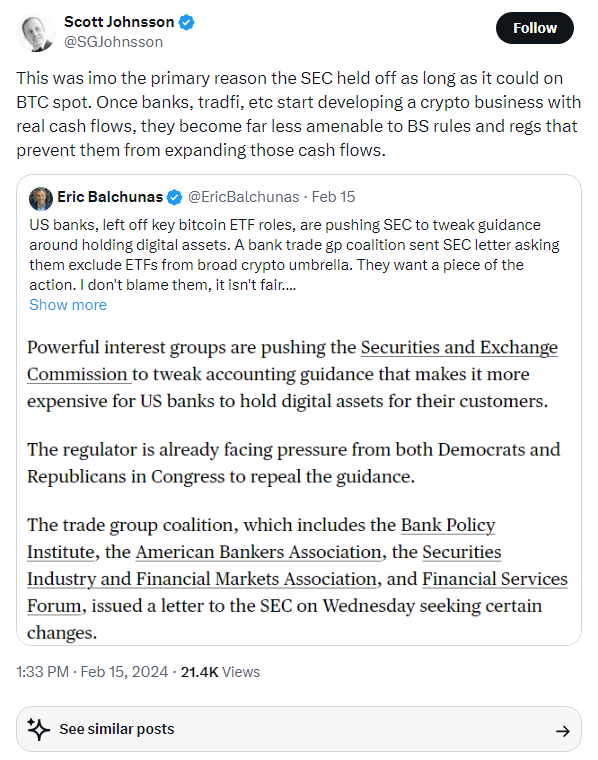
https://twitter.com/SGJohnsson/status/1758197889338052833
https://twitter.com/nestayxbt/status/1758607348967350296

What’s Happening Now?
Bitcoin(BTC)
Bitcoin has continued to rally past its 8-week SMA without any other technical support.

On the daily time frame, Bitcoin has rallied to the top of the 10th resistance region.

Ethereum(Eth)
Ethereum has continued rallying above its 8-week SMA.

Ethereum has pushed into the middle of the 10th region.

Cardano(Ada)
Cardano has continued moving higher above its 8-week SMA but still has a way to go before reaching its 200-week SMA.

On the daily time frame, ADA has reached the top of the 6th region.

What Might Happen Next?
Keep reading with a 7-day free trial
Subscribe to Riding The Wave to keep reading this post and get 7 days of free access to the full post archives.