


Riding The Wave Weekly Outlook #108
Welcome to Riding The Wave. If you have questions or feedback, please reply to this email. If you are new to the Newsletter, please check out what we provide on our about page and consider subscribing. Within the Newsletter, I provide News Summaries, Weekly Status Updates, & Deep Dive Articles on Specific Topics (Ex: How do I pick which coins/tokens to buy?). More details here
Table of Contents
Tweets
What’s Happening Now?
What Might Happen Next?
Tweets
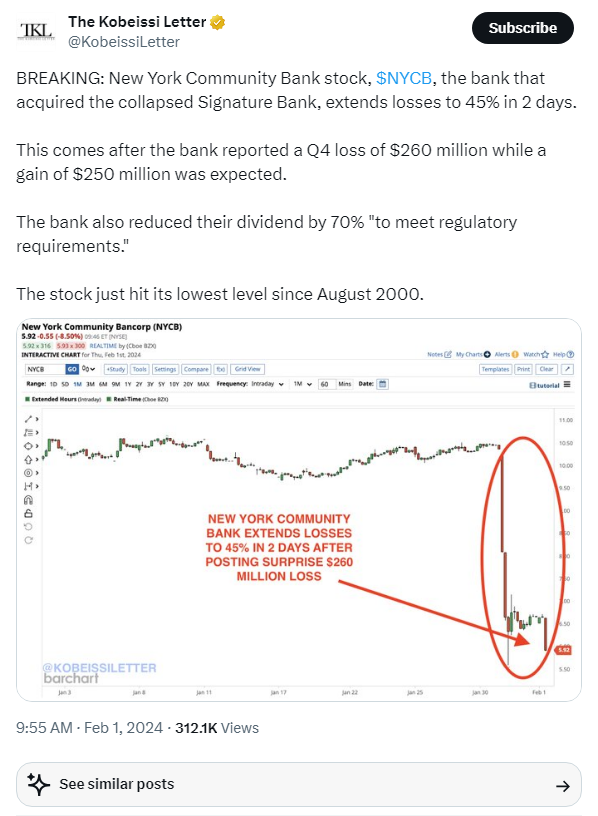
https://twitter.com/KobeissiLetter/status/1753069629377781954
https://twitter.com/nickgerli1/status/1752849711541735428

https://twitter.com/WatcherGuru/status/1753455503097659561

https://twitter.com/WatcherGuru/status/1753109940179481038

https://twitter.com/KobeissiLetter/status/1753132561092546928

https://twitter.com/Matt_Hougan/status/1753183681110564931

https://twitter.com/WallStreetSilv/status/1753141078100750494

https://twitter.com/GameofTrades_/status/1753474612653166780

https://twitter.com/APompliano/status/1753241684677157279

What’s Happening Now?
Bitcoin(BTC)
Bitcoin has continued to hold steady near its 8-week SMA.
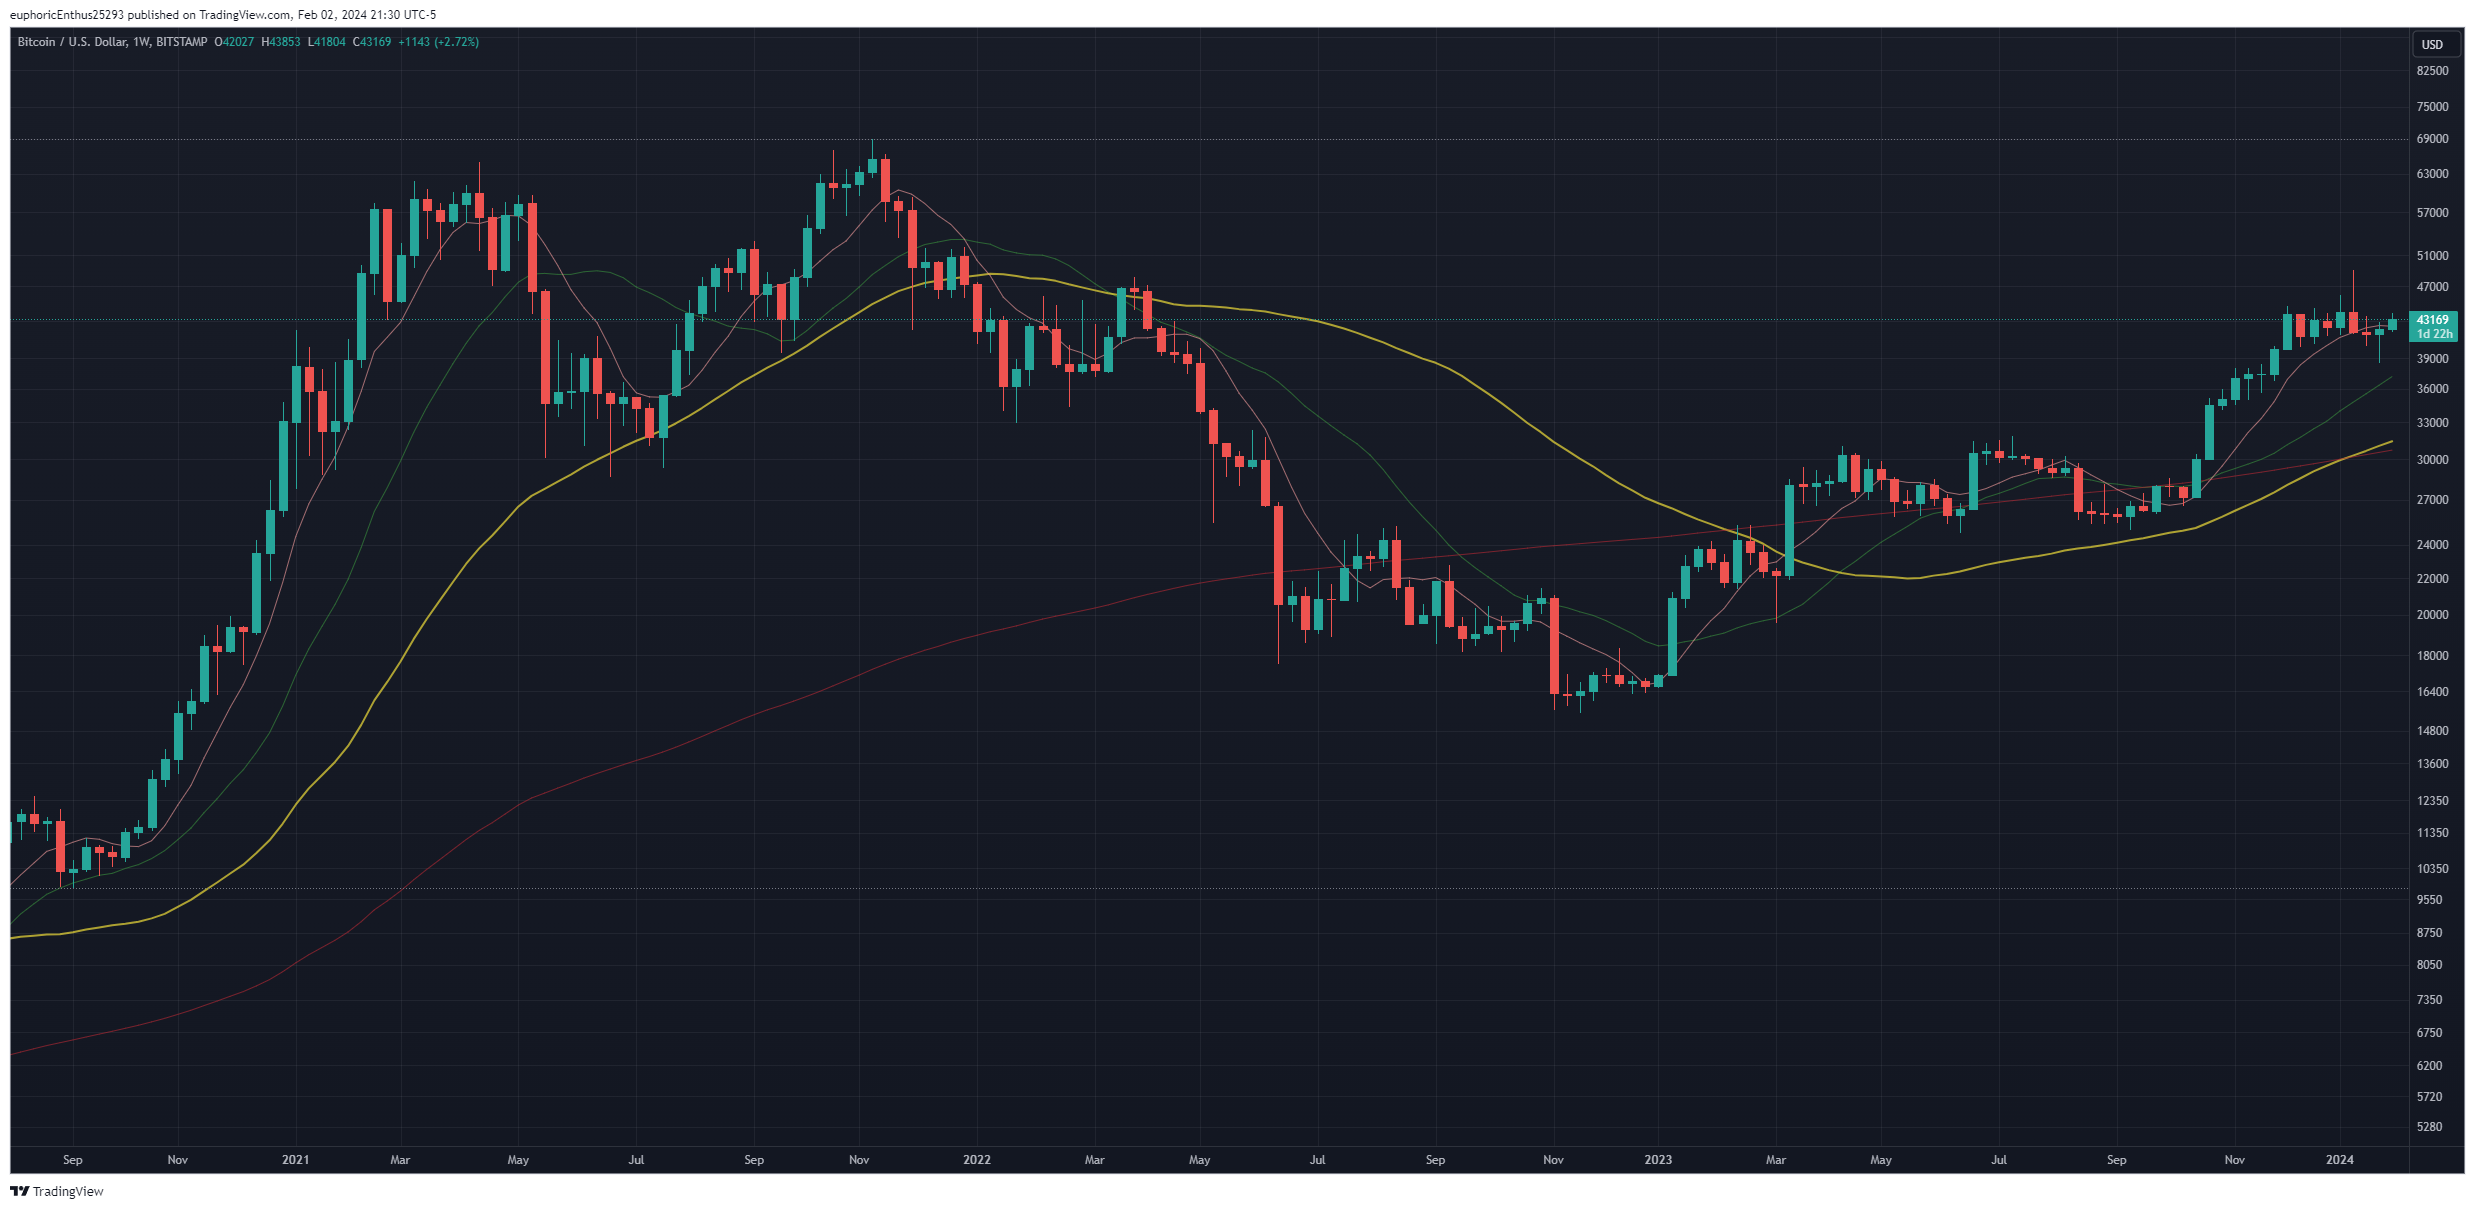
On the daily time frame, Bitcoin has rallied off of the bottom of the 8th resistance region and moved to near the top of the 8th region.

Ethereum(Eth)
Ethereum has pulled back to just above its 8-week SMA.

Ethereum has continued within the 9th region.

Cardano(Ada)
Cardano is once again attempting to break through its 8-week SMA.
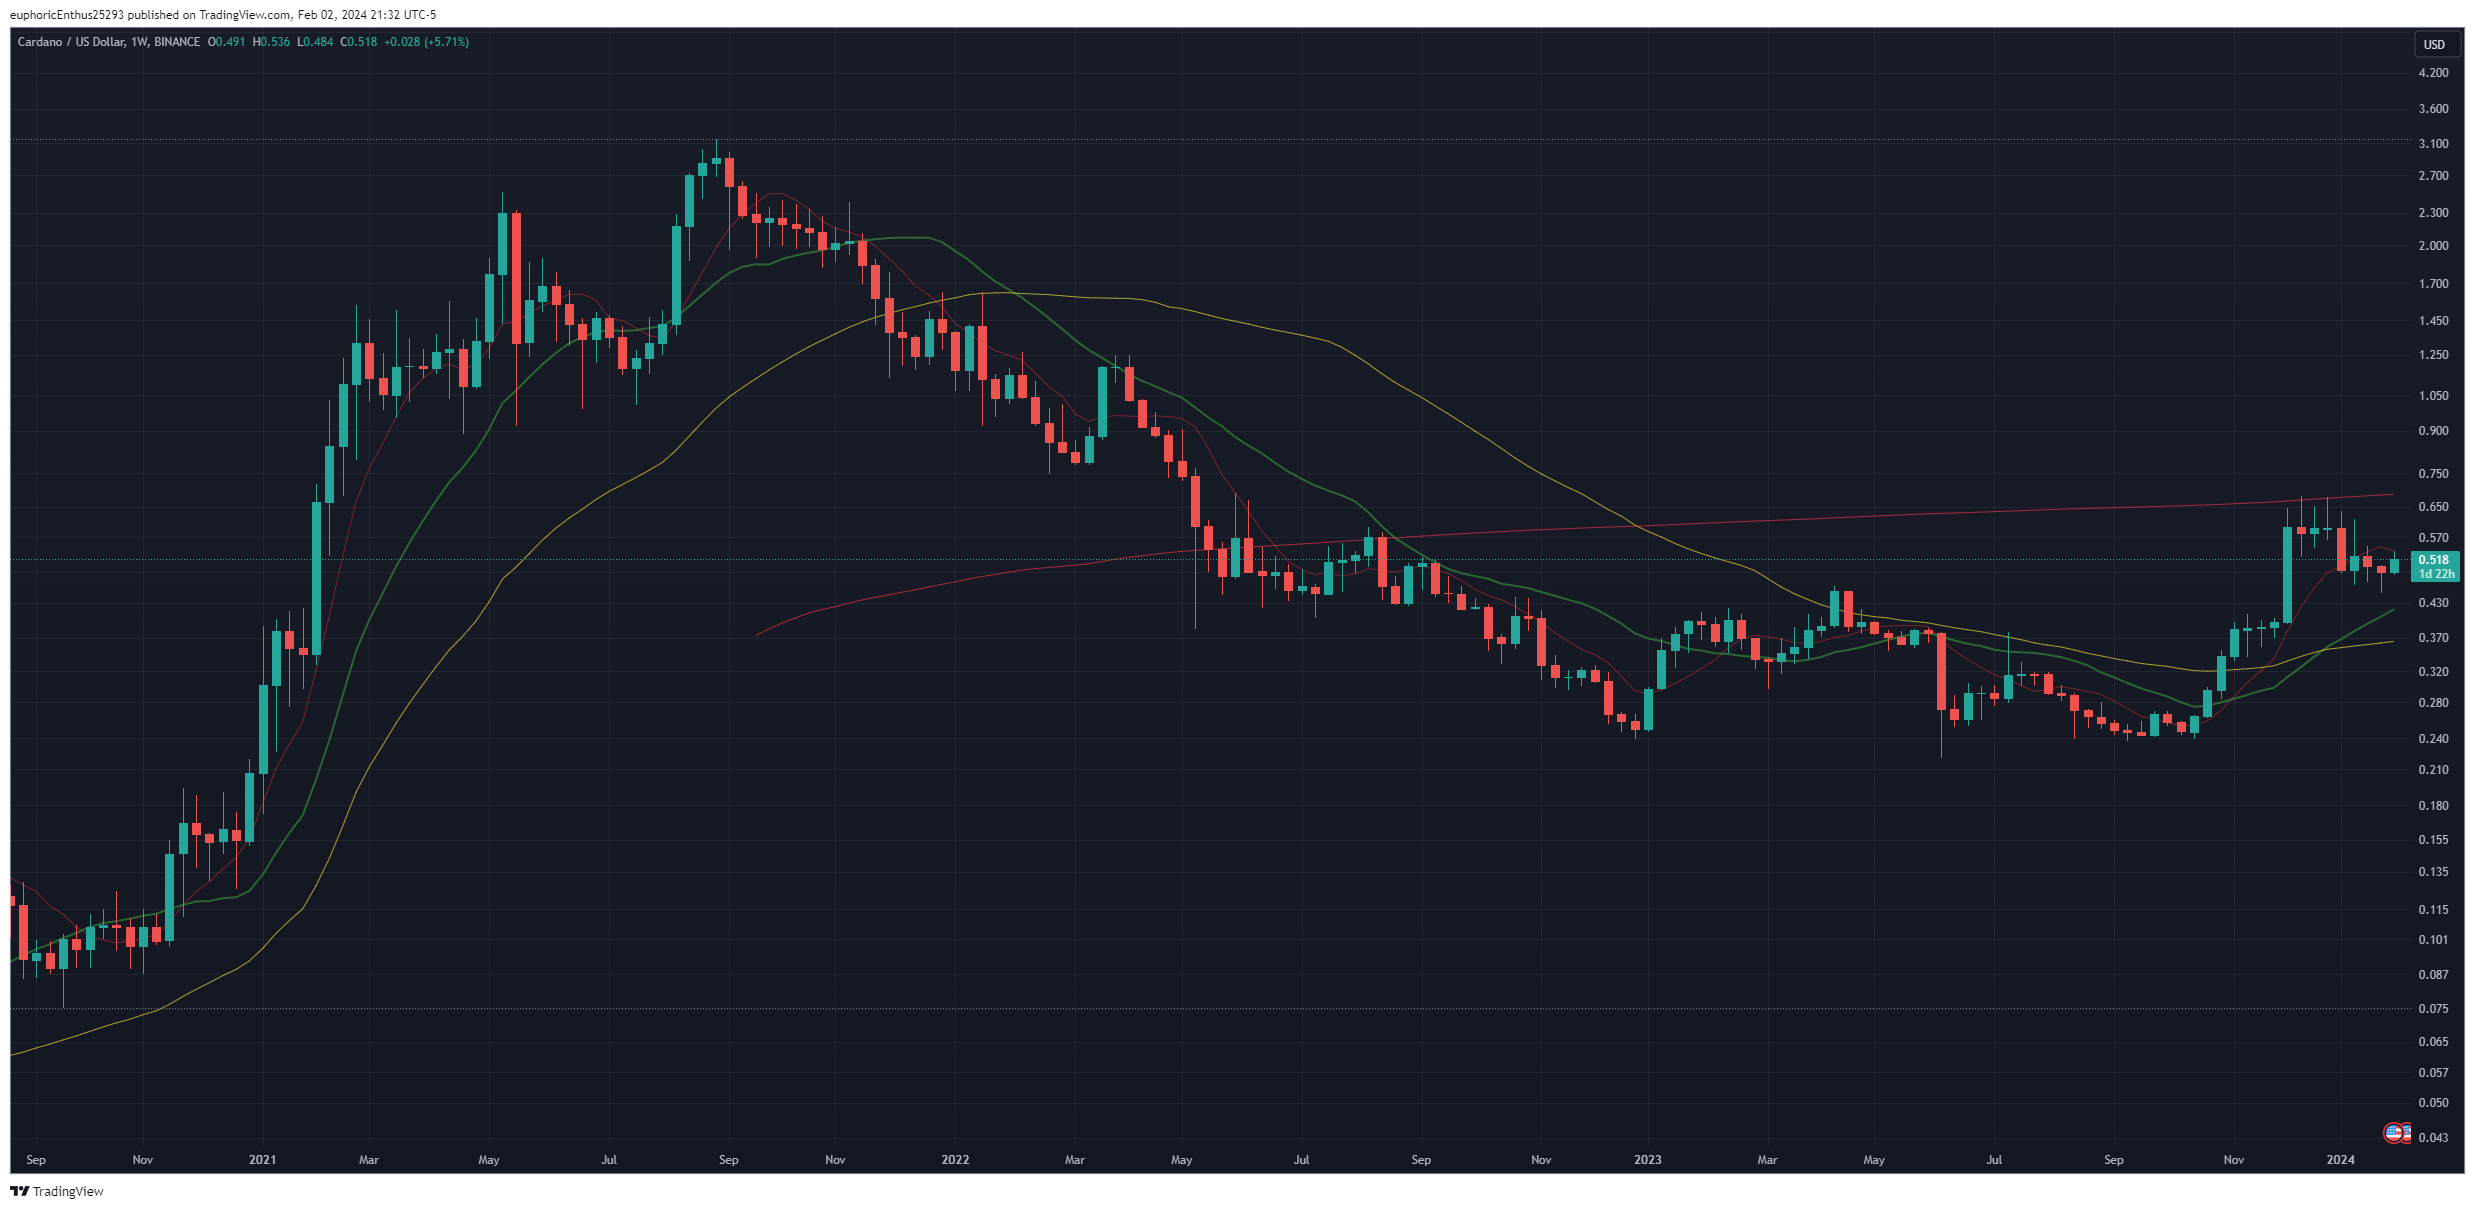
On the daily time frame, ADA has moved to the middle of the 6th region.

What Might Happen Next?
Keep reading with a 7-day free trial
Subscribe to Riding The Wave to keep reading this post and get 7 days of free access to the full post archives.