


Riding The Wave Weekly Outlook #107
Welcome to Riding The Wave. If you have questions or feedback, please reply to this email. If you are new to the Newsletter, please check out what we provide on our about page and consider subscribing. Within the Newsletter, I provide News Summaries, Weekly Status Updates, & Deep Dive Articles on Specific Topics (Ex: How do I pick which coins/tokens to buy?). More details here
Table of Contents
Tweets
What’s Happening Now?
What Might Happen Next?
Tweets
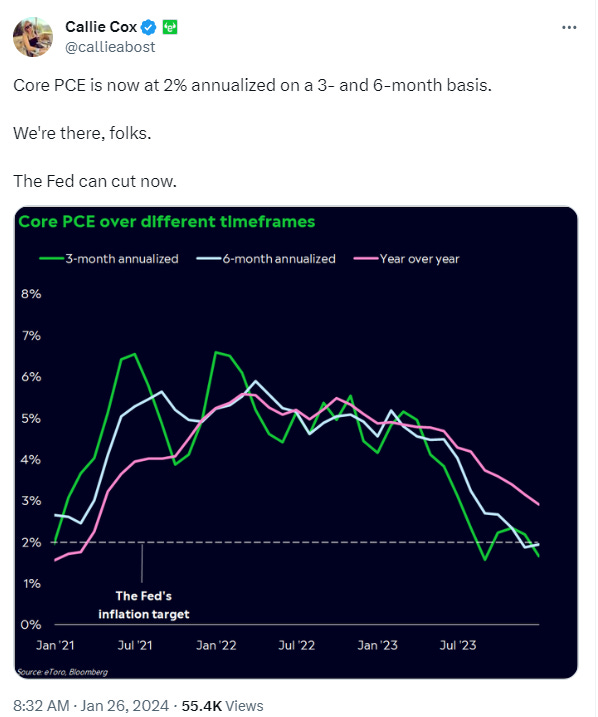
https://twitter.com/callieabost/status/1750874260489261058
https://twitter.com/DocumentingBTC/status/1750344086328922390

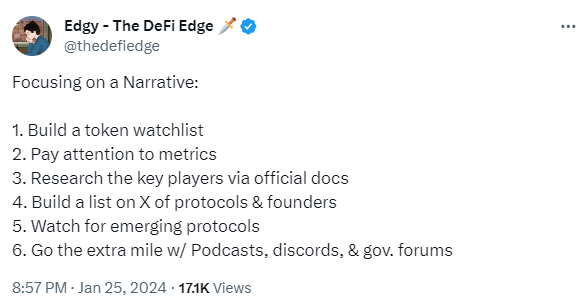
https://twitter.com/thedefiedge/status/1750699543283564853
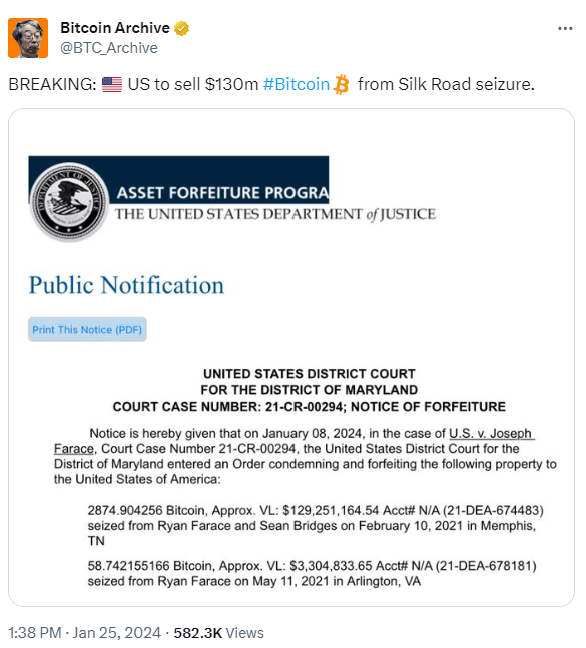
https://twitter.com/BTC_Archive/status/1750589008273666196
https://twitter.com/KobeissiLetter/status/1750325272136528081

What’s Happening Now?
Bitcoin(BTC)
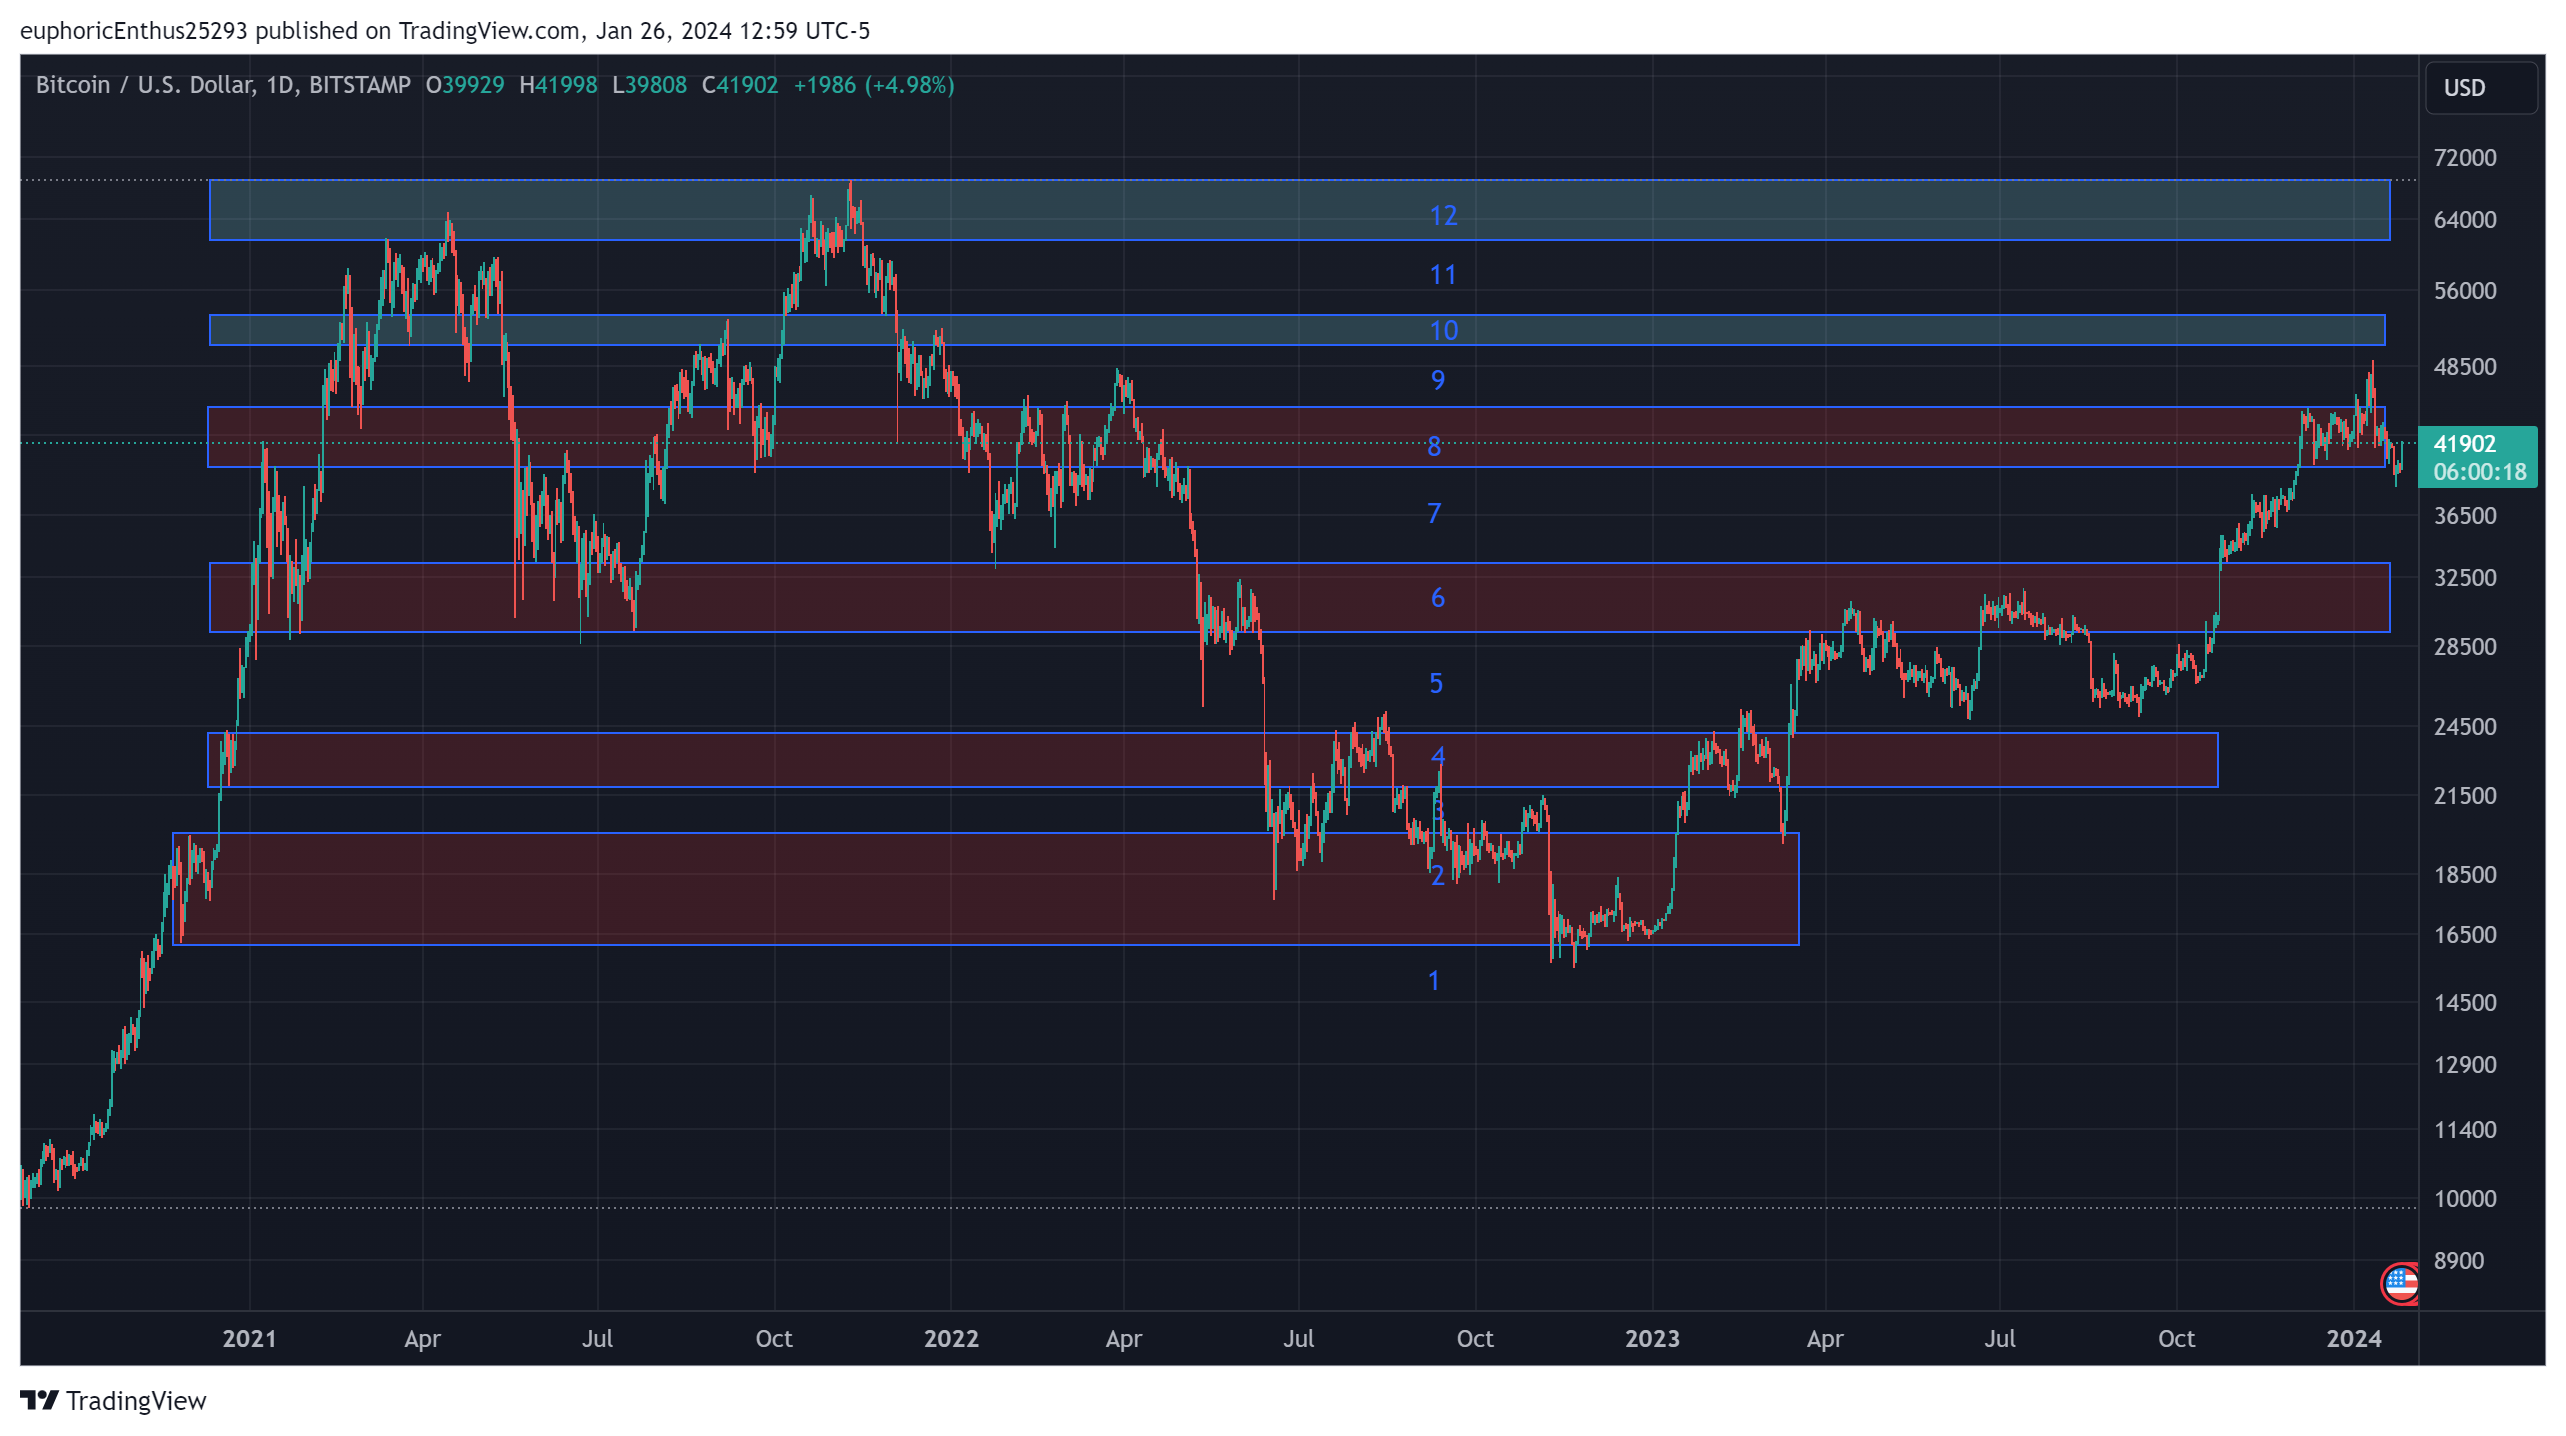
Bitcoin appears to be holding steady just under its 8-week SMA.

On the daily time frame, Bitcoin has found support at the bottom of the 8th resistance region and moved slightly upwards afterward.
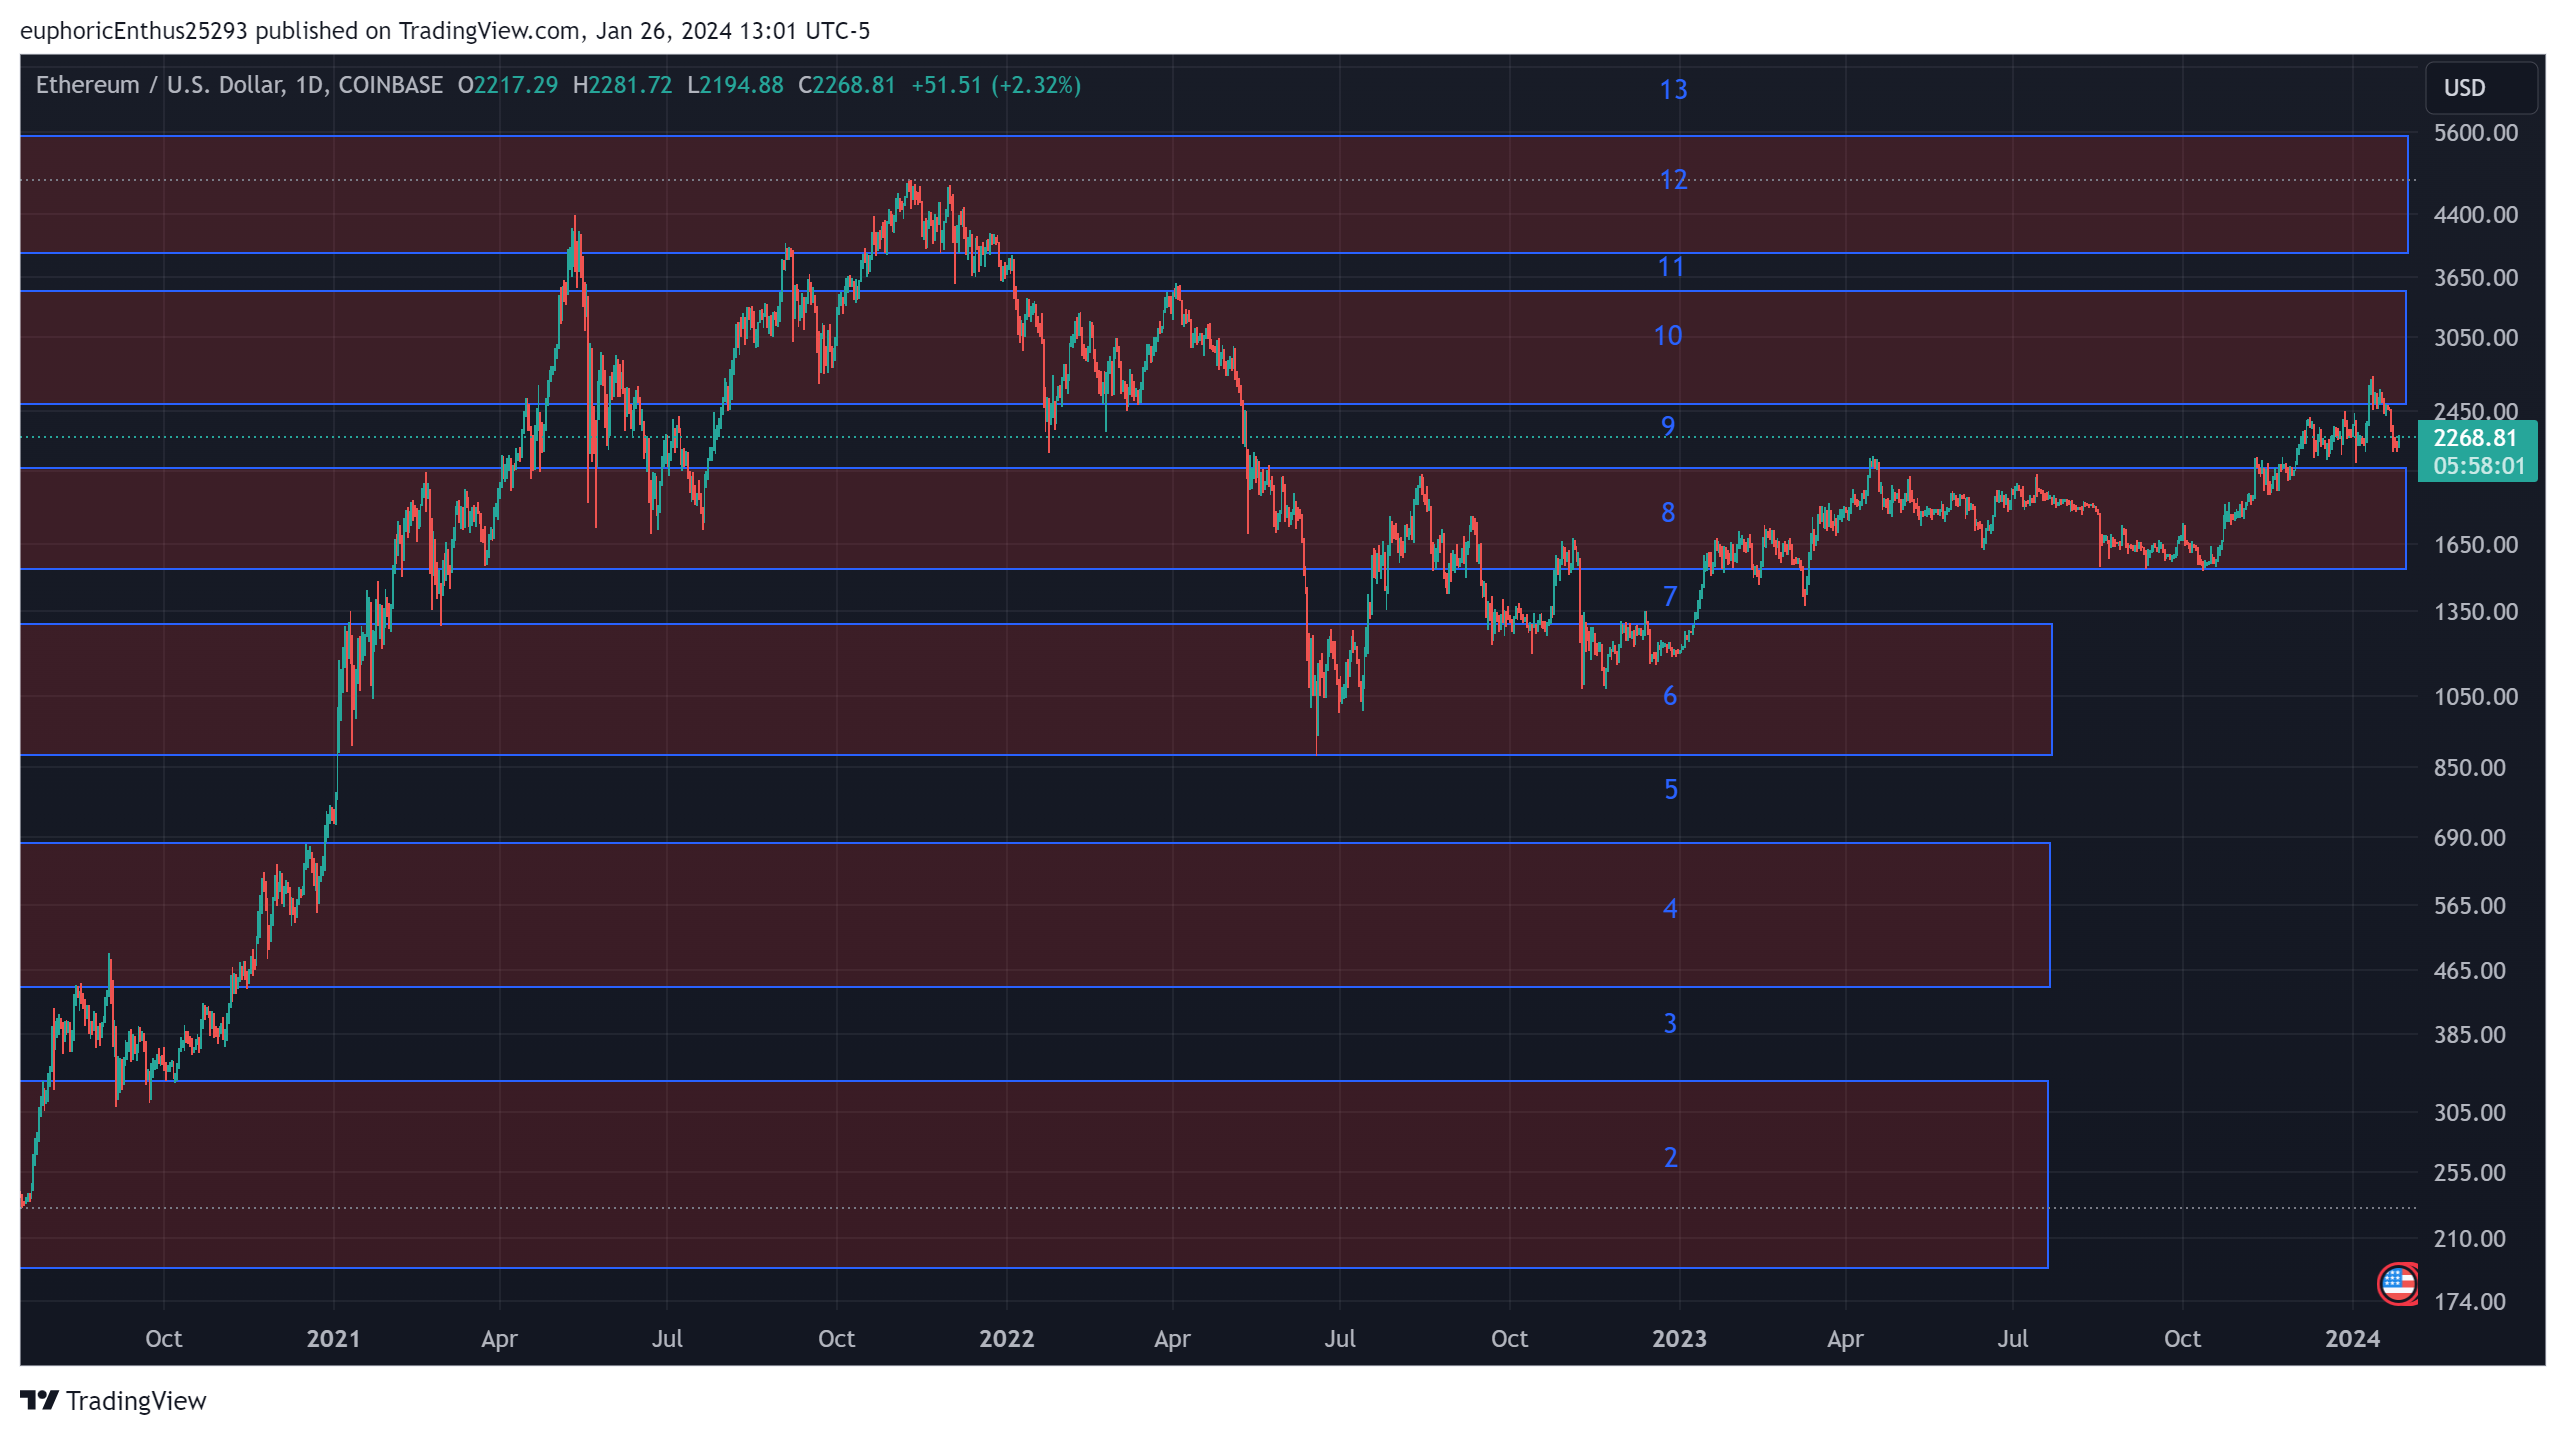
Ethereum(Eth)
Ethereum has dropped just below its 8-week SMA.

Ethereum has failed to hold the bottom of the 10th region and fallen to the bottom of the 9th region.
Cardano(Ada)
Cardano has failed to break through its 8-week SMA and has moved sideways with a slight downward bias.

On the daily time frame, ADA is now at the bottom of the 6th region.

What Might Happen Next?
Keep reading with a 7-day free trial
Subscribe to Riding The Wave to keep reading this post and get 7 days of free access to the full post archives.