Riding The Wave Weekly Outlook #1
Can we hold the 50 week SMA or will we head back to no man's land
Hello Everyone, quick reminder before jumping in the 14-day free trial is available to everyone until the end of December. If you haven’t signed up yet, make sure to check it out & if you already signed up, feel free to share this email & the link with anyone you know who enjoys deep dive crypto content.
Table of Contents
Where are we Short-term?
Where are we Long term?
Supporting Evidence
Where are we short-term?
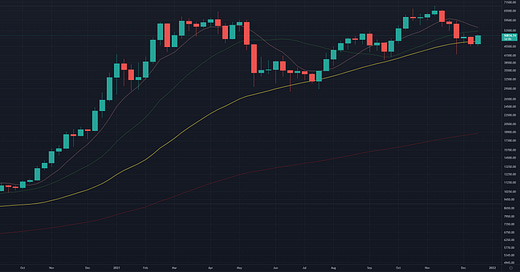
At this exact moment, I am cautiously optimistic. We have just broken out of no man’s land above the 50 week Simple Moving Average (Yellow Line in image 1).
Everyone has been extremely nervous recently, as in the previous run, we consistently held the 20 week SMA (Green Line image 2)
Due to this, the drop through to the 50 week SMA & then underneath it put us into uncharted territory. Us breaking up above the 50 week SMA represents a possible return to normalcy, and if we hold, it gives us the opportunity to do the same for the 20 week and 8 week SMA. After that point, the market will hopefully have enough confidence and excitement to get a second leg started where we have the hopes of going parabolic and getting the traditional blow-off top.
I will be less cautious and more optimistic if this weekly candle closes above the 50 week SMA or, even better, the 20 week(Green line Image 1)/8 week(light purple line Image 1) SMA.
Where are we Long term?
In the long term, I still believe there are several possible outcomes (from most to least likely) of:
We have a double top with two separate but similar peaks.
We have a double top with two separate and different peaks (Ex: First part of the run mainly bouncing off the 8 week SMA and occasionally the 20 week SMA with the second part of the run being a different variation more similar to the 2018 bull run/some other behavior).
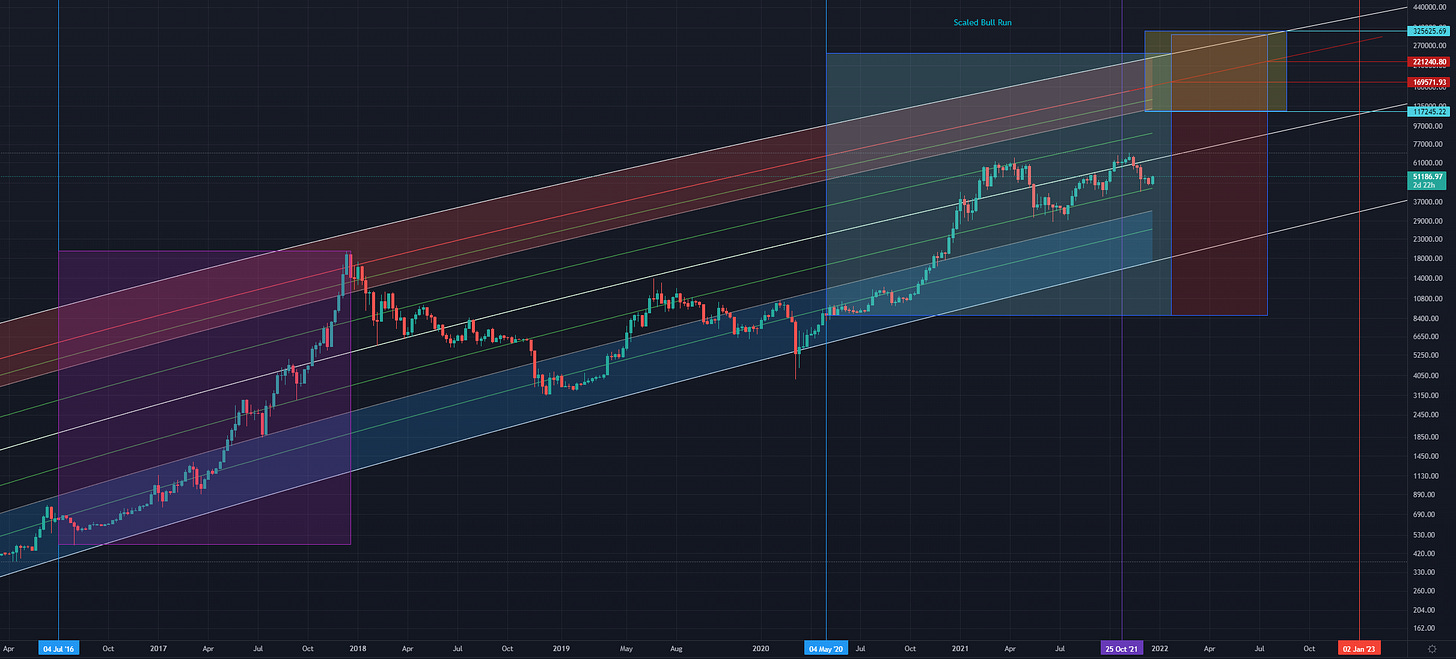
We gradually move upwards with small ups and downs (basically more frequent mini bull runs and bear runs with us not reaching the bottom of the logarithmic growth curve or the top of the logarithmic growth curve).
We move sideways and continue consolidating before breaking up or down.
We drop down from here into a bear market.
Based on what we have seen so far (Bitcoin consolidating after the first run even though we faced the end of year tax prepping/profit locking/China ban and not dropping down sharply), I am heavily leaning towards options 1 or 2, but we will see how this run continues to develop. Number 3 could be supported by what we have seen between July and December of this year (Hig
her highs and higher lows gradually moving us higher on the macro scale), but at least so far, I think it is more likely that it is just part of our consolidation before moving to the second stage & eventually a blow-off top.

4 & 5 are also entirely possible, but I would be surprised if we continued to consolidate for much longer or if we went down into a bear market from the position we are currently at.
Overall for the long term, I am incredibly bullish 👍
Supporting Evidence
The NVT indicator has previously signaled oversold before we see an increase in the short term.


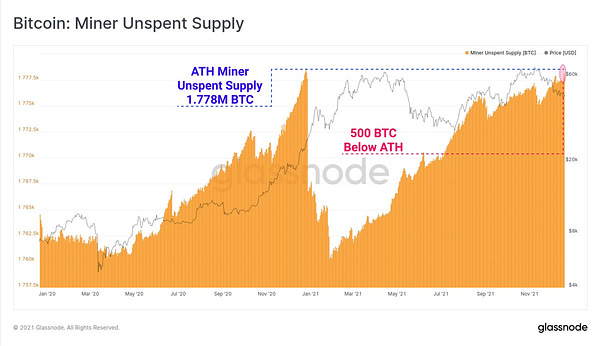
Miner unspent supply (whether Miners are selling what they mine or are holding it to sell later, Orange is the amount of BTC saved and black line in the background is BTC price) did a decent job of indicating when we were getting overheated in the first half of this run. We will have to see if it does the same in the second half.


PI cycle top indicator has a healthy amount of room before crossing (indicating we may be near a top)
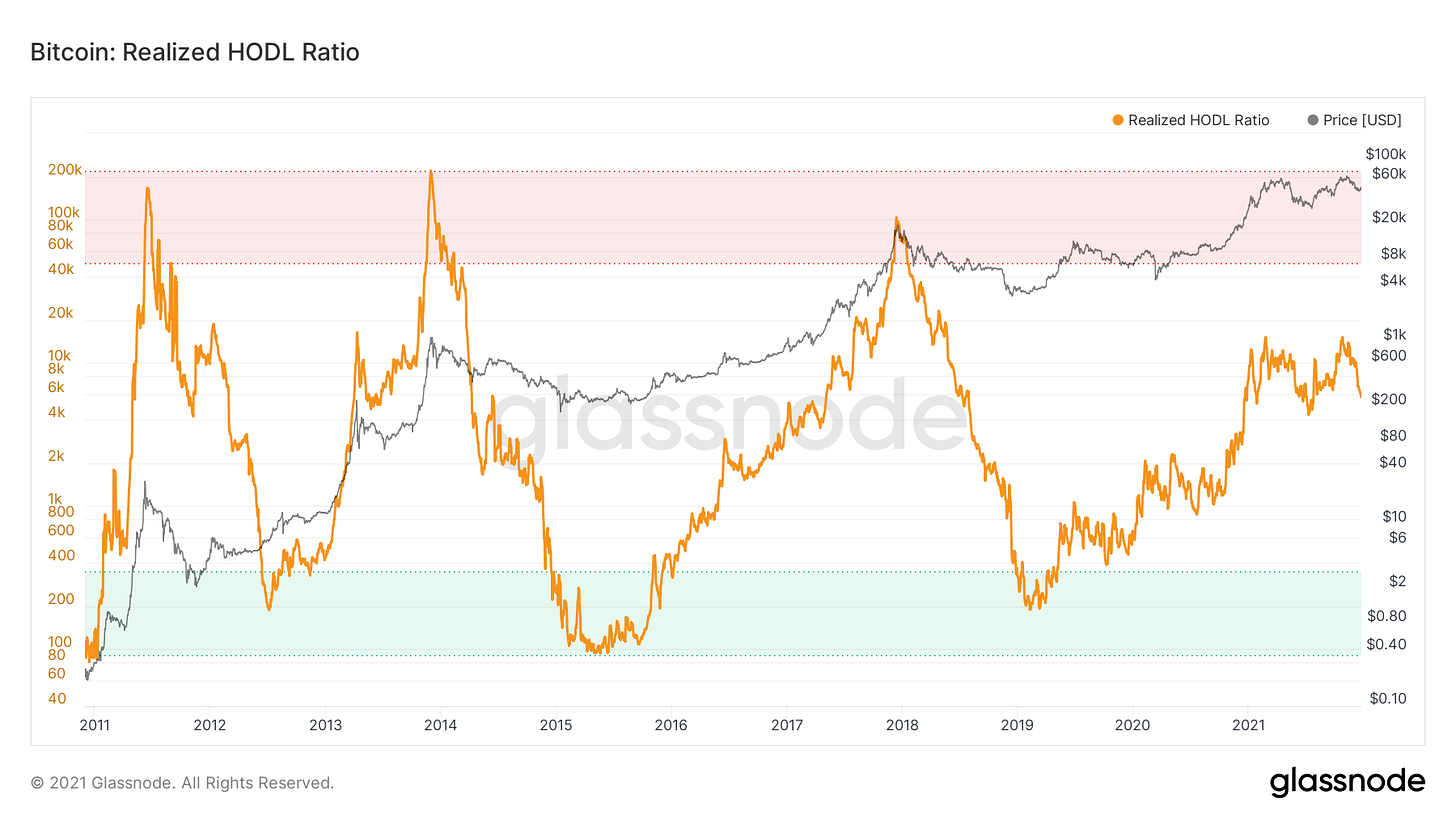
The Realized Hodl Ratio (Described by glassnode as “The Realized HODL Ratio is a market indicator that uses a ratio of the Realized Cap HODL Waves. In particular, the RHODL Ratio takes the ratio between the 1 week and the 1-2 years RCap HODL bands. In addition, it accounts for increased supply by weighting the ratio by the total market age. A high ratio is an indication of an overheated market and can be used to time cycle tops. This metric was created by Philip Swift.“) didn’t get close to topping out in the first half of the bull run & has a lot of room to grow.
As shown by Benjamin Cowen, lengthening cycles would validate this not being the top as well as normalize why we have had this consolidation period.


Disclaimer: The information in this Newsletter is not financial, legal, or tax advice. I only trade on Etoro; if you are reached out to by people requesting you join a group or provide money, it is not me. My only public social media accounts are this Substack page, my Youtube page, and my Etoro page; any others you see online are not me.


